

Quarterly Market Outlook for Q4 2026: Rising Rates, New Market Highs, and Fed Hikes
Provided by Rainer Wealth Management
The third quarter was mixed for investors with two major drivers impacting portfolios. On the one hand, interest rates rose to 20-year highs, while on the other hand, exceptional corporate earnings continued to support stocks. Amid these major trends, oil prices climbed back above $100 per barrel, the Fed raised rates for the first time in three years, and concerns over AI grew as November’s midterm election approaches.
Despite these developments, major U.S. stock market indices ended the quarter not far from their all-time highs. Just as important, these gains were not limited to a single part of the market. The energy sector, developed market stocks, and commodities also contributed to portfolios over the quarter. And while the bond market has struggled as rates have risen, bond yields are at their most attractive levels in recent history.
These market themes are a reminder that maintaining portfolio balance is the key to navigating ever-changing market environments, especially when they create opportunities for long-term investing and financial planning. How can investors stay balanced as these events unfold in the fourth quarter?
Key Market and Economic Drivers in Q3 20261
• The S&P 500 returned 2.3% in the third quarter with dividends and the Nasdaq Composite gained 2.6%, while the Dow Jones Industrial Average declined -2.3%. Year-to-date, the three indices have returned 12.7%, 16.1%, and 7.2%, respectively.
• Developed market international stocks (MSCI EAFE) gained 0.9%, while emerging market stocks (MSCI EM) declined -0.4% over the quarter, both in U.S. dollar terms.
• The Bloomberg U.S. Aggregate Bond Index fell -3.5% in the third quarter for a year-to-date decline of -2.9%, with longer-dated bonds struggling. The 10-year Treasury yield climbed to 5.29%, a two-decade high.
• The Bloomberg Commodity Index jumped 15.1% over the quarter. Brent crude ended the quarter at $103 per barrel while WTI finished at $90.
• Gold fell further to $4,156 per ounce, while the U.S. Dollar Index recovered to 101.45.
• August headline CPI rose 3.4% year-over-year, while core CPI, which excludes volatile food and energy prices, increased only 2.4%. The core PCE price index, the Fed's preferred measure of underlying inflation, rose 3.0% year-over-year in August.
• The Federal Reserve raised its key policy rate to a range of 3.75% to 4.00% in September.
• The third estimate of second quarter GDP showed that growth was better than expected at 2.2% quarter-over-quarter. This was primarily driven by a 2.5% gain in personal consumption expenditures.
Investors are adjusting to a higher interest rate environment
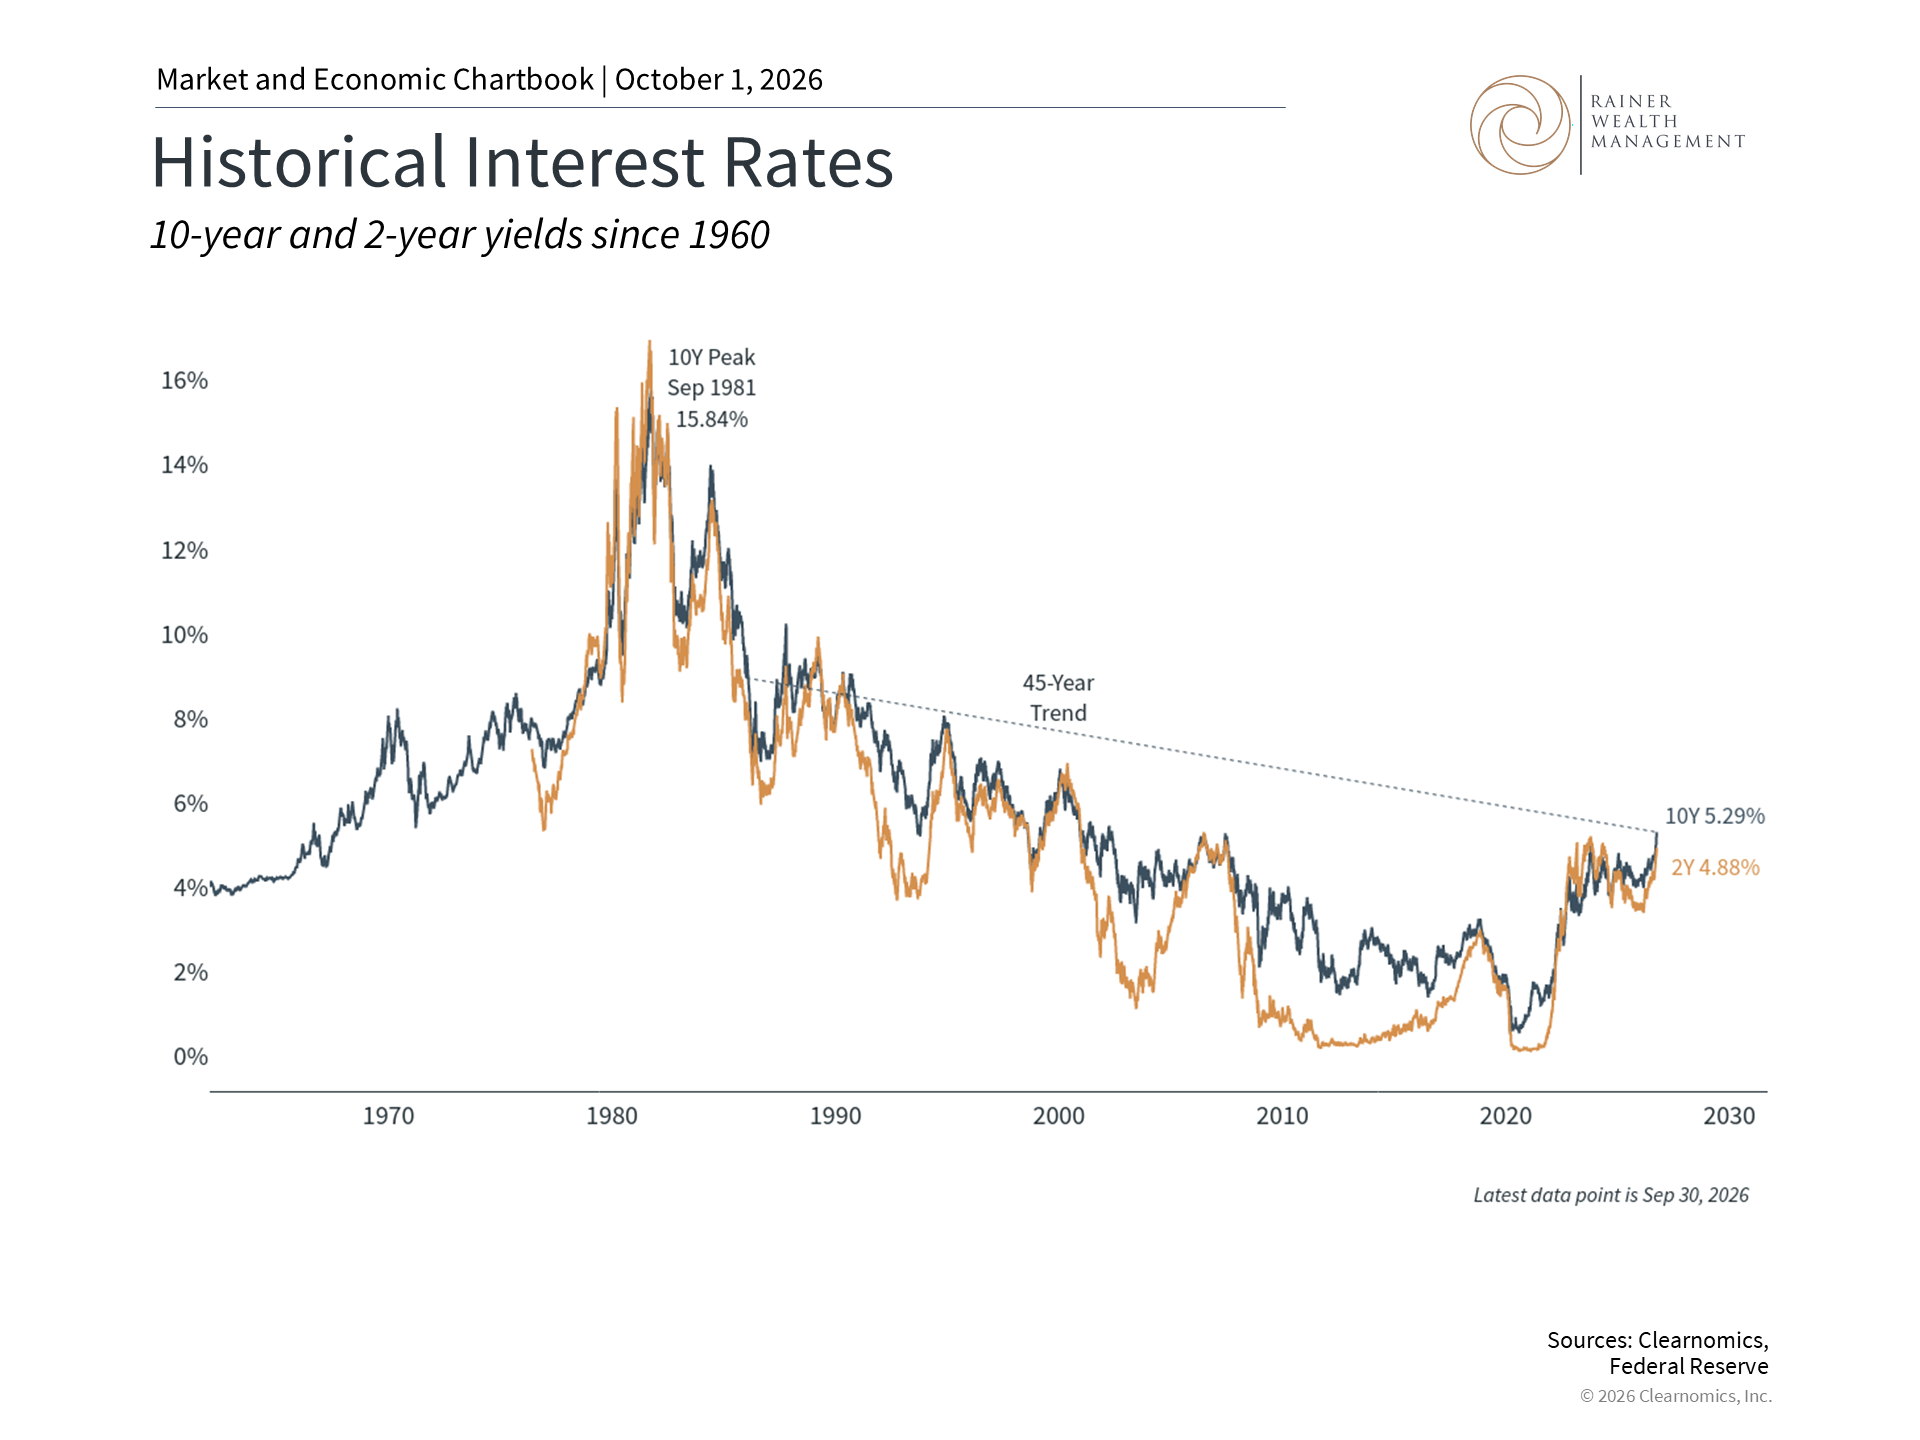
This chart shows 2-year and 10-year Treasury yields.
The defining feature of the third quarter was the steady climb in interest rates to levels not seen since the early 2000s. For long-term investors, this matters because the low-rate environment following the 2008 global financial crisis is no longer the main driver of portfolio decisions. The fact that bonds can generate more income today is an important consideration in asset allocation decisions.
It’s helpful to take a historical perspective when it comes to interest rate trends. From the peak in the early 1980s to 2020, there was a gradual but steady decline in interest rates, with short-term fluctuations due to the business cycle and economic events.2 This period is often referred to as a 40-year bull market in bonds, since falling interest rates make existing bonds more attractive, helping support portfolios as well as the broader economy.
High interest rates affect many other parts of the economy as well, particularly the housing market. According to Freddie Mac, the average 30-year fixed-rate mortgage is back above 7% after falling toward 6% at the start of the year.3 This creates what economists refer to as the "lock-in" effect, in which homeowners who benefited from low rates in prior years face a disincentive to sell, reducing housing market activity.
Of course, interest rates are difficult to predict and subject to swings, especially with oil prices and the job market facing uncertainty. Still, interest rates are hovering near multi-decade highs, which is an important development for investors.
Earnings growth and AI investments are supporting many asset classes
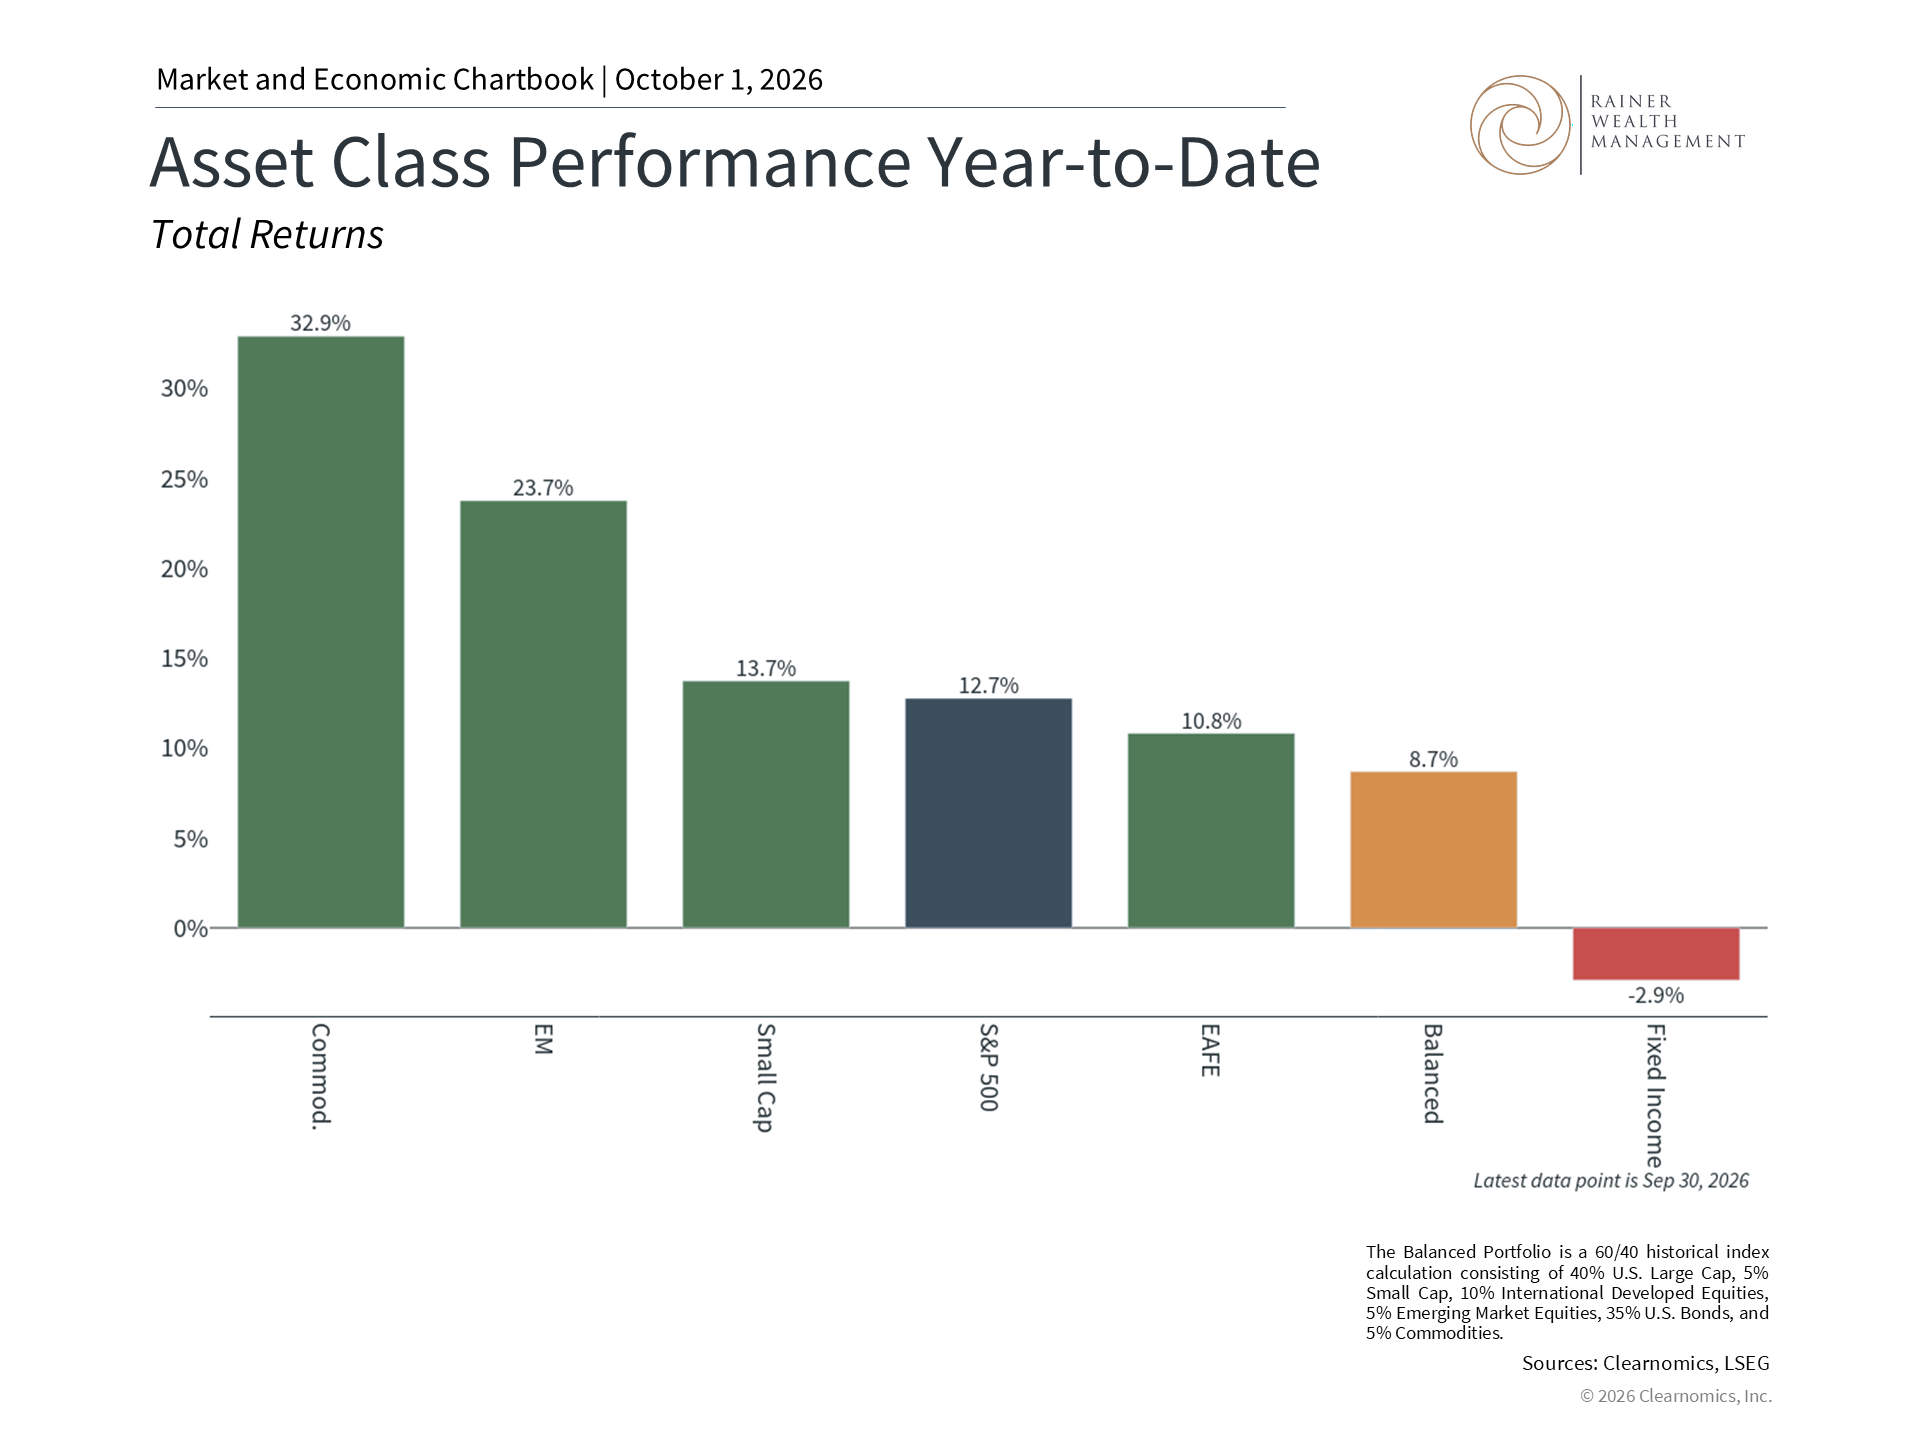
This chart shows total asset class returns year-to-date. Asset classes included are MSCI Emerging Markets Index (EM), MSCI Developed Markets Index (EAFE), MSCI World Small Cap Index (Small Cap), S&P 500, balanced portfolio, fixed income, and MSCI World Commodity Producers Index (comm.). The balanced portfolio is a historical 60/40 portfolio consisting of 40% U.S. large cap, 5% small cap, 10% international developed equities, 5% emerging market equities, 35% U.S. bonds, and 5% commodities.
Despite many periods of short-term uncertainty, the S&P 500, Nasdaq, and Dow Jones Industrial Average all reached new all-time highs in the third quarter. This is largely because U.S. stocks have benefited from a strong economy and trends such as AI infrastructure investment, which have supported corporate profitability. Current consensus estimates suggest that the S&P 500 could experience earnings growth across 2026 of over 30% for the next twelve months.4
This year’s positive performance hasn’t been restricted to U.S. large cap stocks, but is a global phenomenon across equity asset classes. Small cap stocks, for instance, struggled in the third quarter but have still outperformed this year since many of these companies play important roles in the AI supply chain. Other regions have also benefited from trends in AI, particularly semiconductor companies in Asia. This has helped to support the MSCI Emerging Market index, although the third quarter saw a decline for this index.5
Commodities have also contributed to portfolios, but for different reasons. Due to the ongoing conflict in the Middle East, oil prices climbed from around $70 per barrel in early July to over $100 in September. Copper reached a new all-time high due to mine supply deficits and structural demand from AI infrastructure, while diesel reached a record due to heavily restricted global refining capacity.
The fact that many asset classes have contributed demonstrates the value of a well-considered asset allocation, which will only grow in importance in the fourth quarter as questions around monetary policy, Treasury yields, and oil prices remain in focus.
The Fed raised rates for the first time in three years
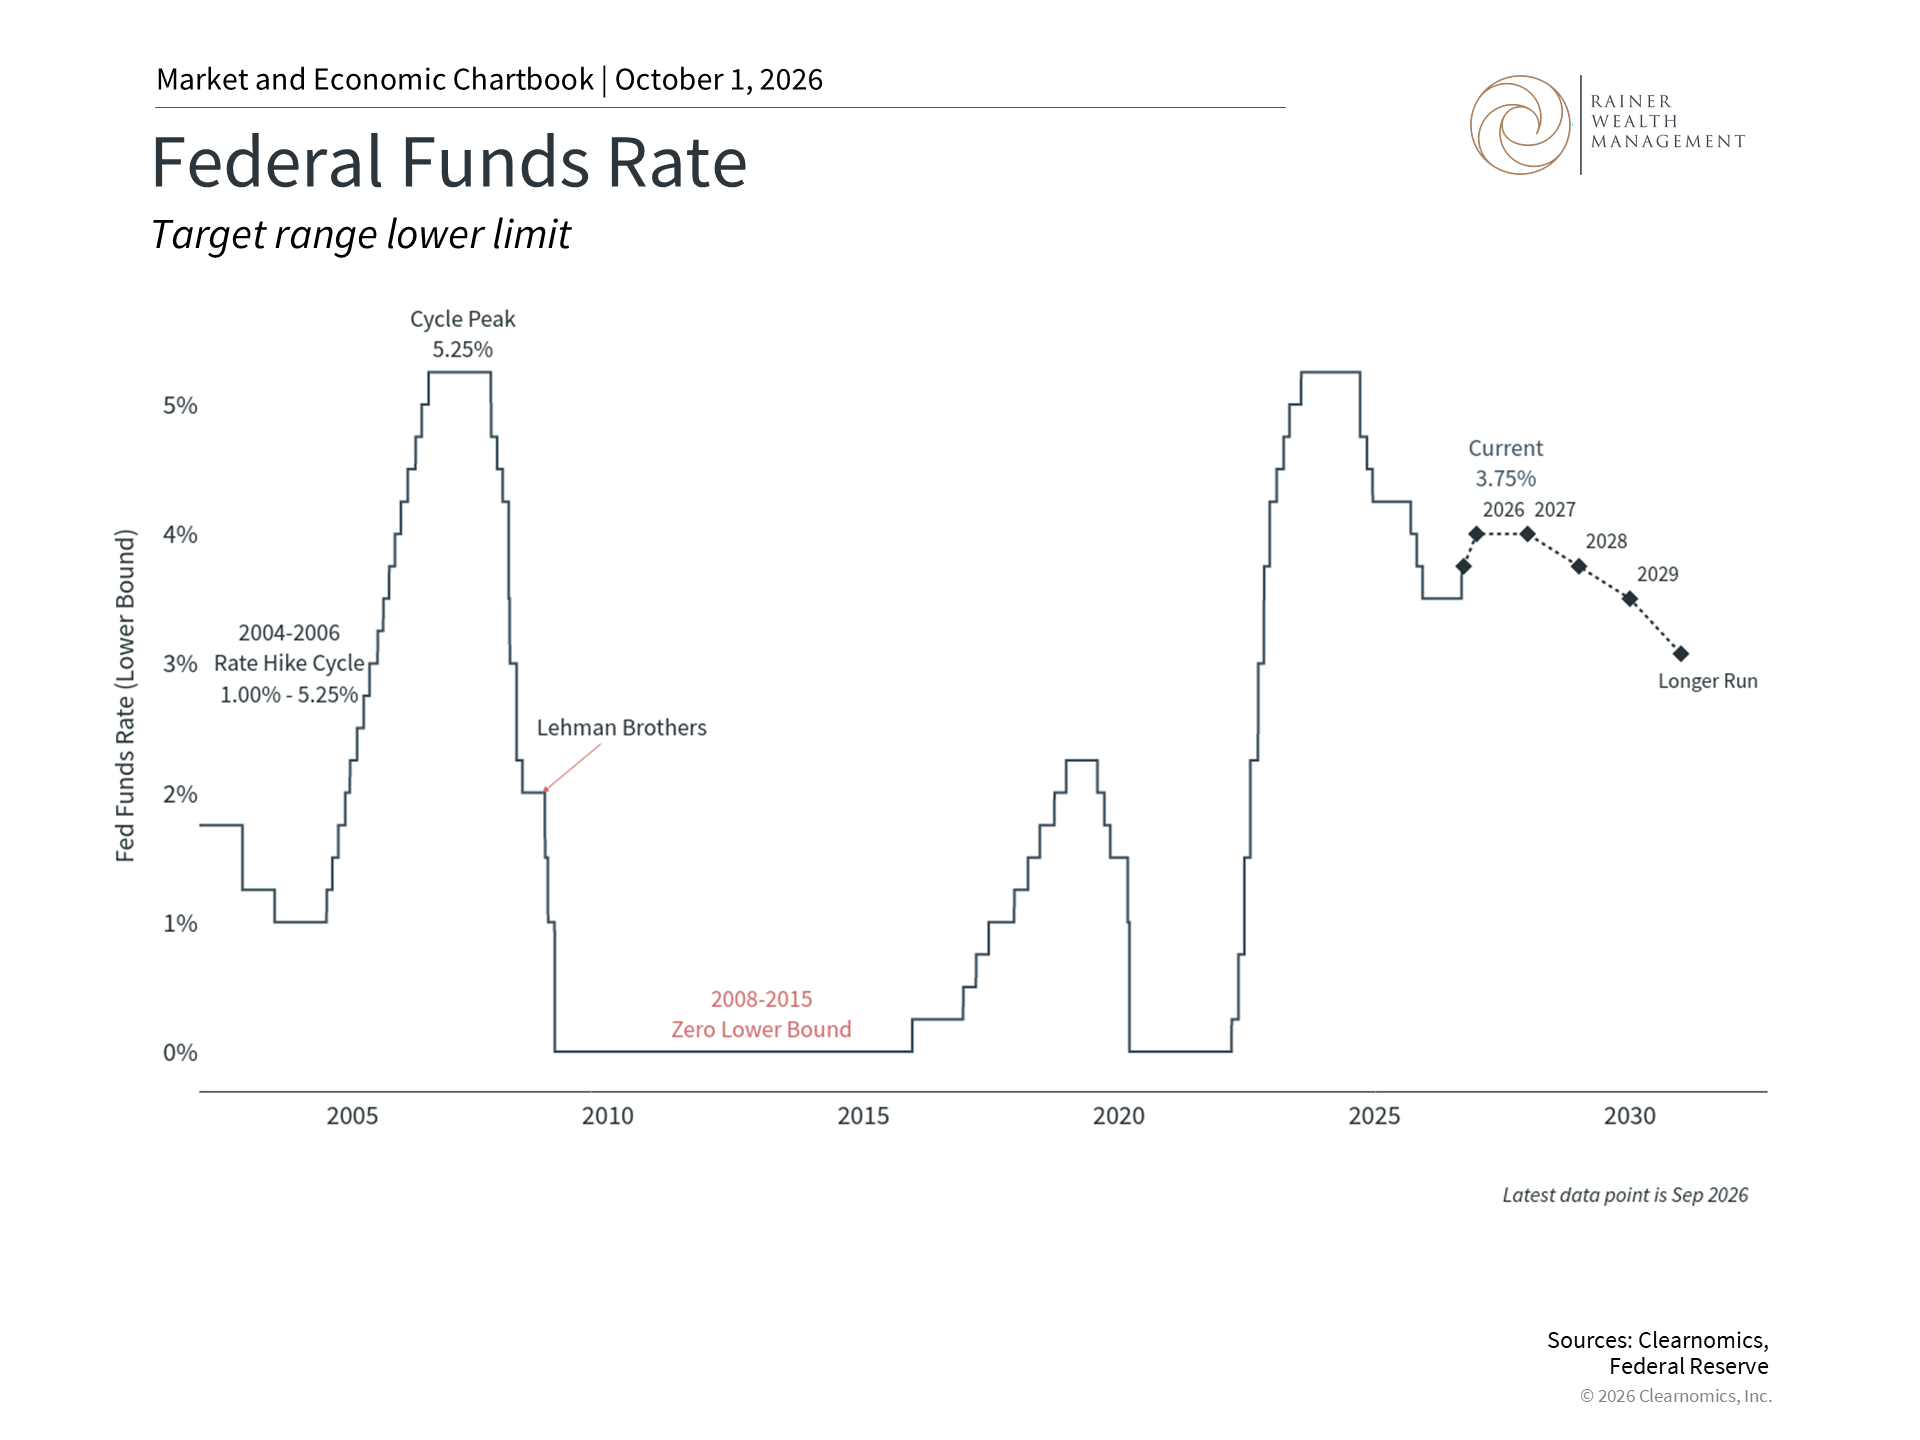
This chart tracks the Federal Funds Rate lower limit. The dotted lines indicate the Federal Open Market Committee's (FOMC) participants' median assessments of appropriate path for the Federal Funds Rate, based on the Summary of Economic Projections.
At its September meeting, the Fed raised policy rates by one-quarter of a percent to a range of 3.75% to 4.00%. This was the first hike in three years and followed a period of rate cuts from September 2024 to December 2025, as shown in the chart above. Investors had assigned the move with over a 90% probability ahead of the meeting, so while there were some market swings immediately after the announcement, the market took the move in stride overall.6
What makes this hike different? The Fed is mostly reacting to higher energy prices. Economists often refer to this as "cost-push inflation," which simply means that supply disruptions have led to higher prices. The Fed cannot resolve geopolitical events with interest rates, but it can try to ensure that higher energy costs do not spread to other inflation categories that affect consumers and businesses.
At the moment, projections by other Fed officials suggest the central bank could raise rates once more this year before pausing through 2027, with rates declining only slowly after that. These projections can change quickly depending on economic trends, so it's important to take them with a grain of salt.
It's natural for some investors to view tighter monetary policy as a headwind for markets. In reality, this depends on why the Fed is raising rates. Historically, it's not unusual for markets and interest rates to move higher together, particularly later in the business cycle when growth, corporate earnings, and capital investment are strong. The third quarter is an example of this, with major stock indices reaching new highs even as rates rose. Of course, monetary policy is only one of the forces that will shape the months ahead, alongside the political calendar.
Upcoming midterm elections and policy uncertainty
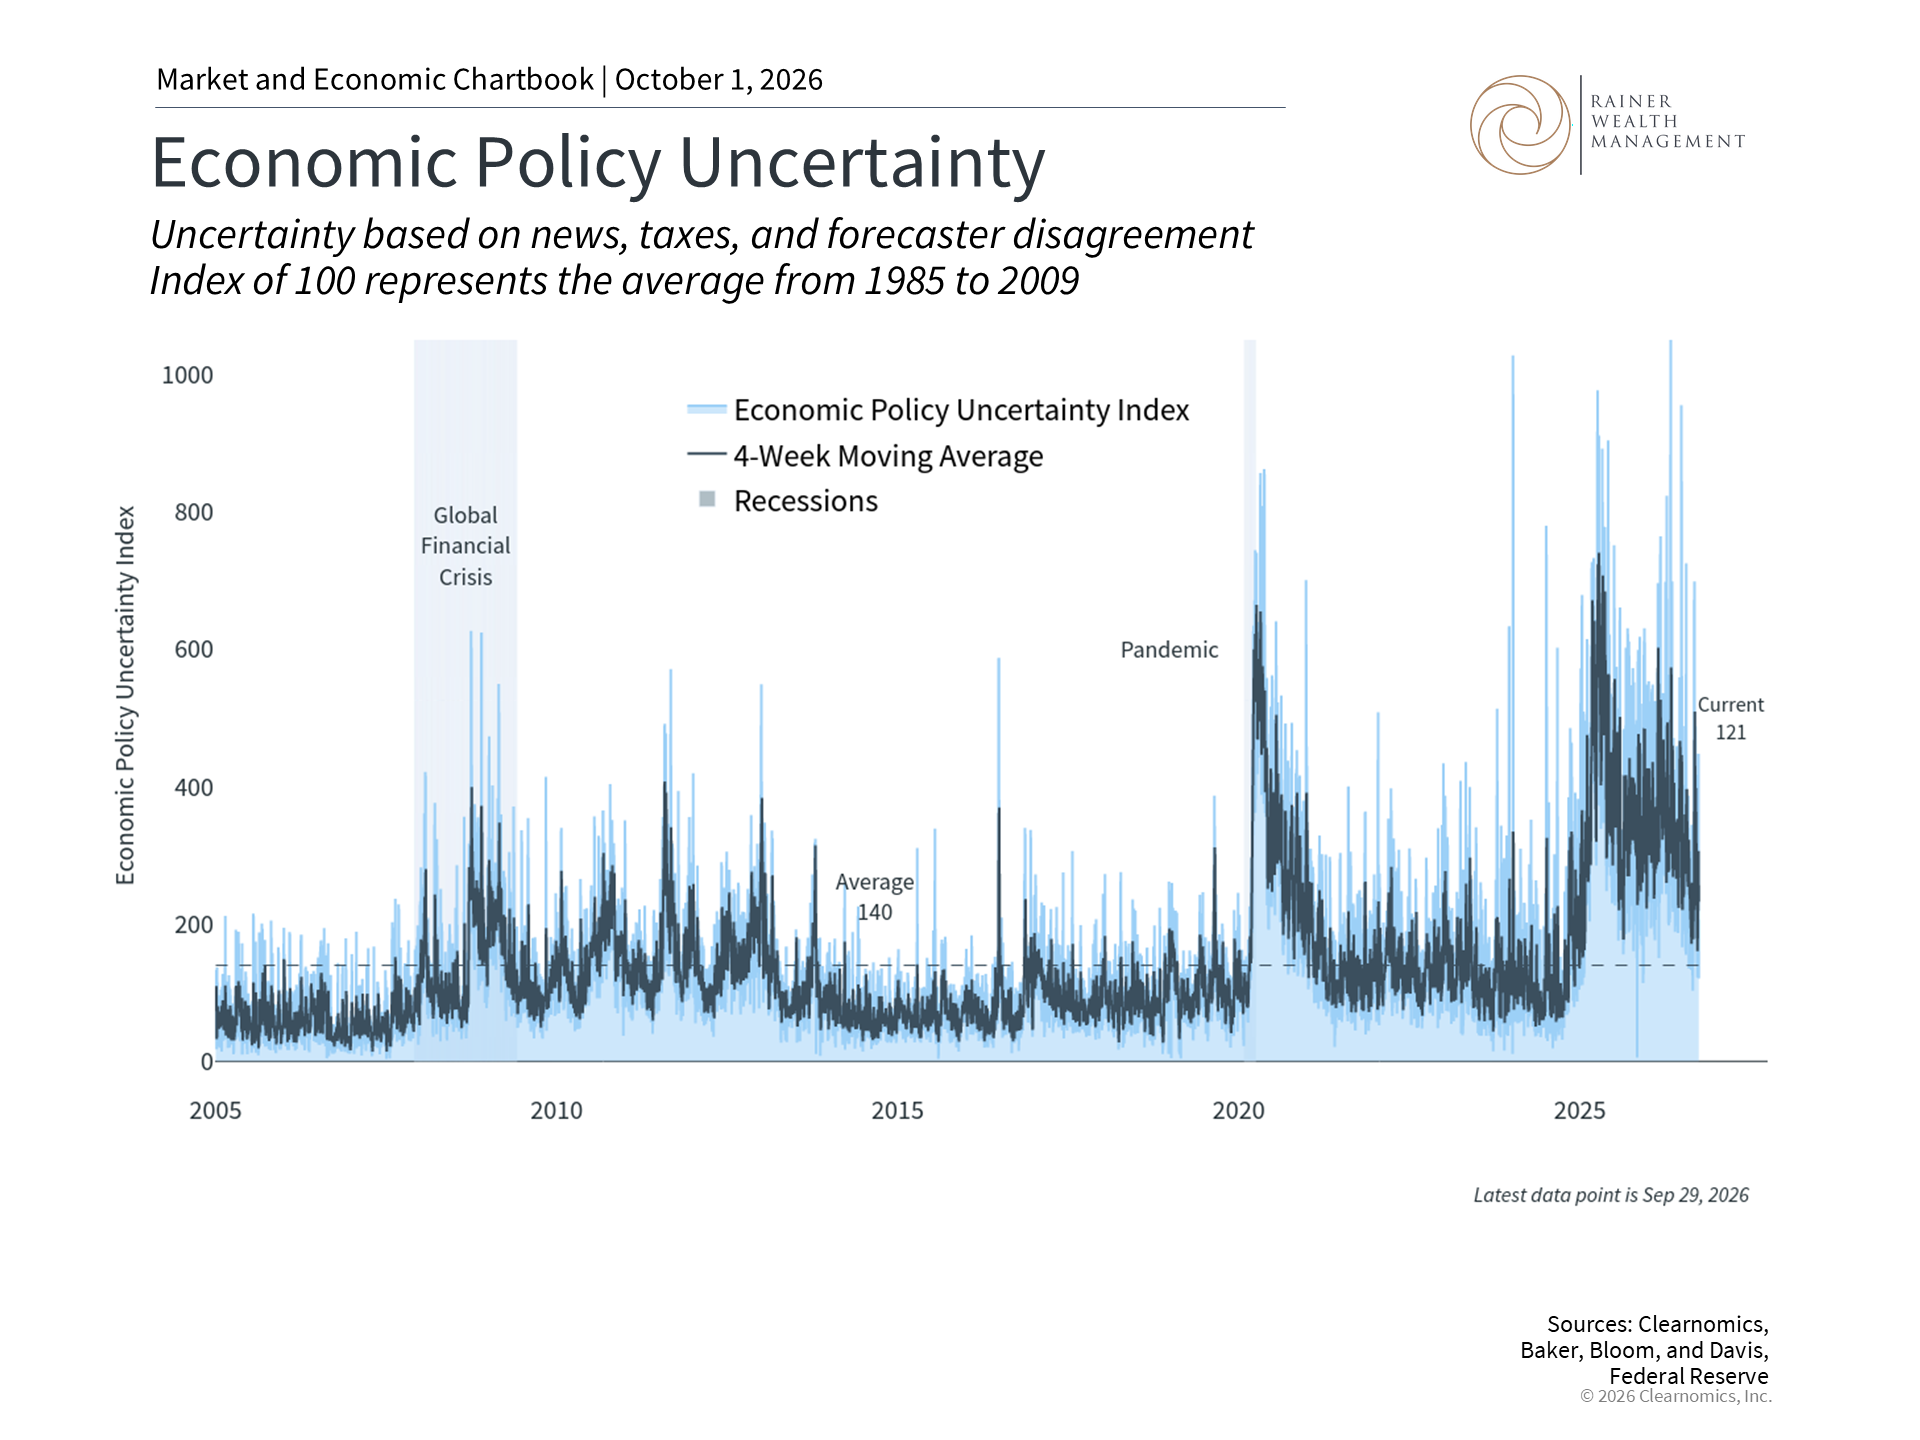
The Economic Policy Uncertainty (EPU) Index quantifies the level of uncertainty related to economic policy decisions. Developed by economists Scott Baker, Nicholas Bloom, and Steven Davis, this index is standardized to a value of 100, representing the average policy uncertainty level observed from 1985 to 2009. The EPU Index methodology integrates three key components: news coverage analysis that counts policy uncertainty mentions in major newspapers; data on future tax code provision expirations that reflects tax environment uncertainty; and measurements of disagreement among professional economic forecasters regarding future inflation and government spending. These components are weighted to create a composite score where higher values indicate elevated policy uncertainty.
As citizens, voters, and taxpayers, there are few things more important than elections. They shape the direction of policy on issues including entitlement programs, taxes, and the federal debt, and they reflect the values by which new policies are made. However, when it comes to investing, it's important for investors to not vote with their portfolios.
This year's midterm election in November is taking place against a complex backdrop of tariffs, geopolitical conflict, inflation, and questions around AI. As the chart above shows, there has been significant economic policy uncertainty over the past two years which resulted in short-term market volatility. At the same time, markets also showed that they can stabilize and rebound in ways that can surprise investors. So, while past performance is no guarantee of future results, it’s important to not overreact to short-term political headlines.
More generally, it’s natural to assume that politics should drive the stock market, or that election years are simply more volatile. History shows that this is not necessarily the case and, in fact, the S&P 500 has averaged annual total returns of 8.6% across midterm election years since 1933.7 Additionally, history shows that markets have performed well on average through different configurations of Congress. It’s not unusual for a sitting president’s party to lose its majority in Congress during a midterm election, and this is exactly what occurred under Biden, Trump’s first term, Obama, and Clinton, just to name a few recent examples.8
That said, there are other sources of political uncertainty beyond who controls the White House and Congress. One topic many investors worry about is the size of the national debt and budget deficit. The total federal debt recently exceeded $40 trillion for the first time, representing almost $120,000 per American.9 The annual budget deficit is also projected to be above $2 trillion for the government’s 2026 fiscal year.10 Over time, these trends could raise borrowing costs for the government and increase the interest payments it must make each year.
While many of these challenges are real, the key is to distinguish between what investors can and cannot control. Holding a portfolio designed to perform well across a range of economic and political environments is more important than trying to predict the result of a single election or where the budget deficit might land next year.
AI, productivity, and stock market sectors
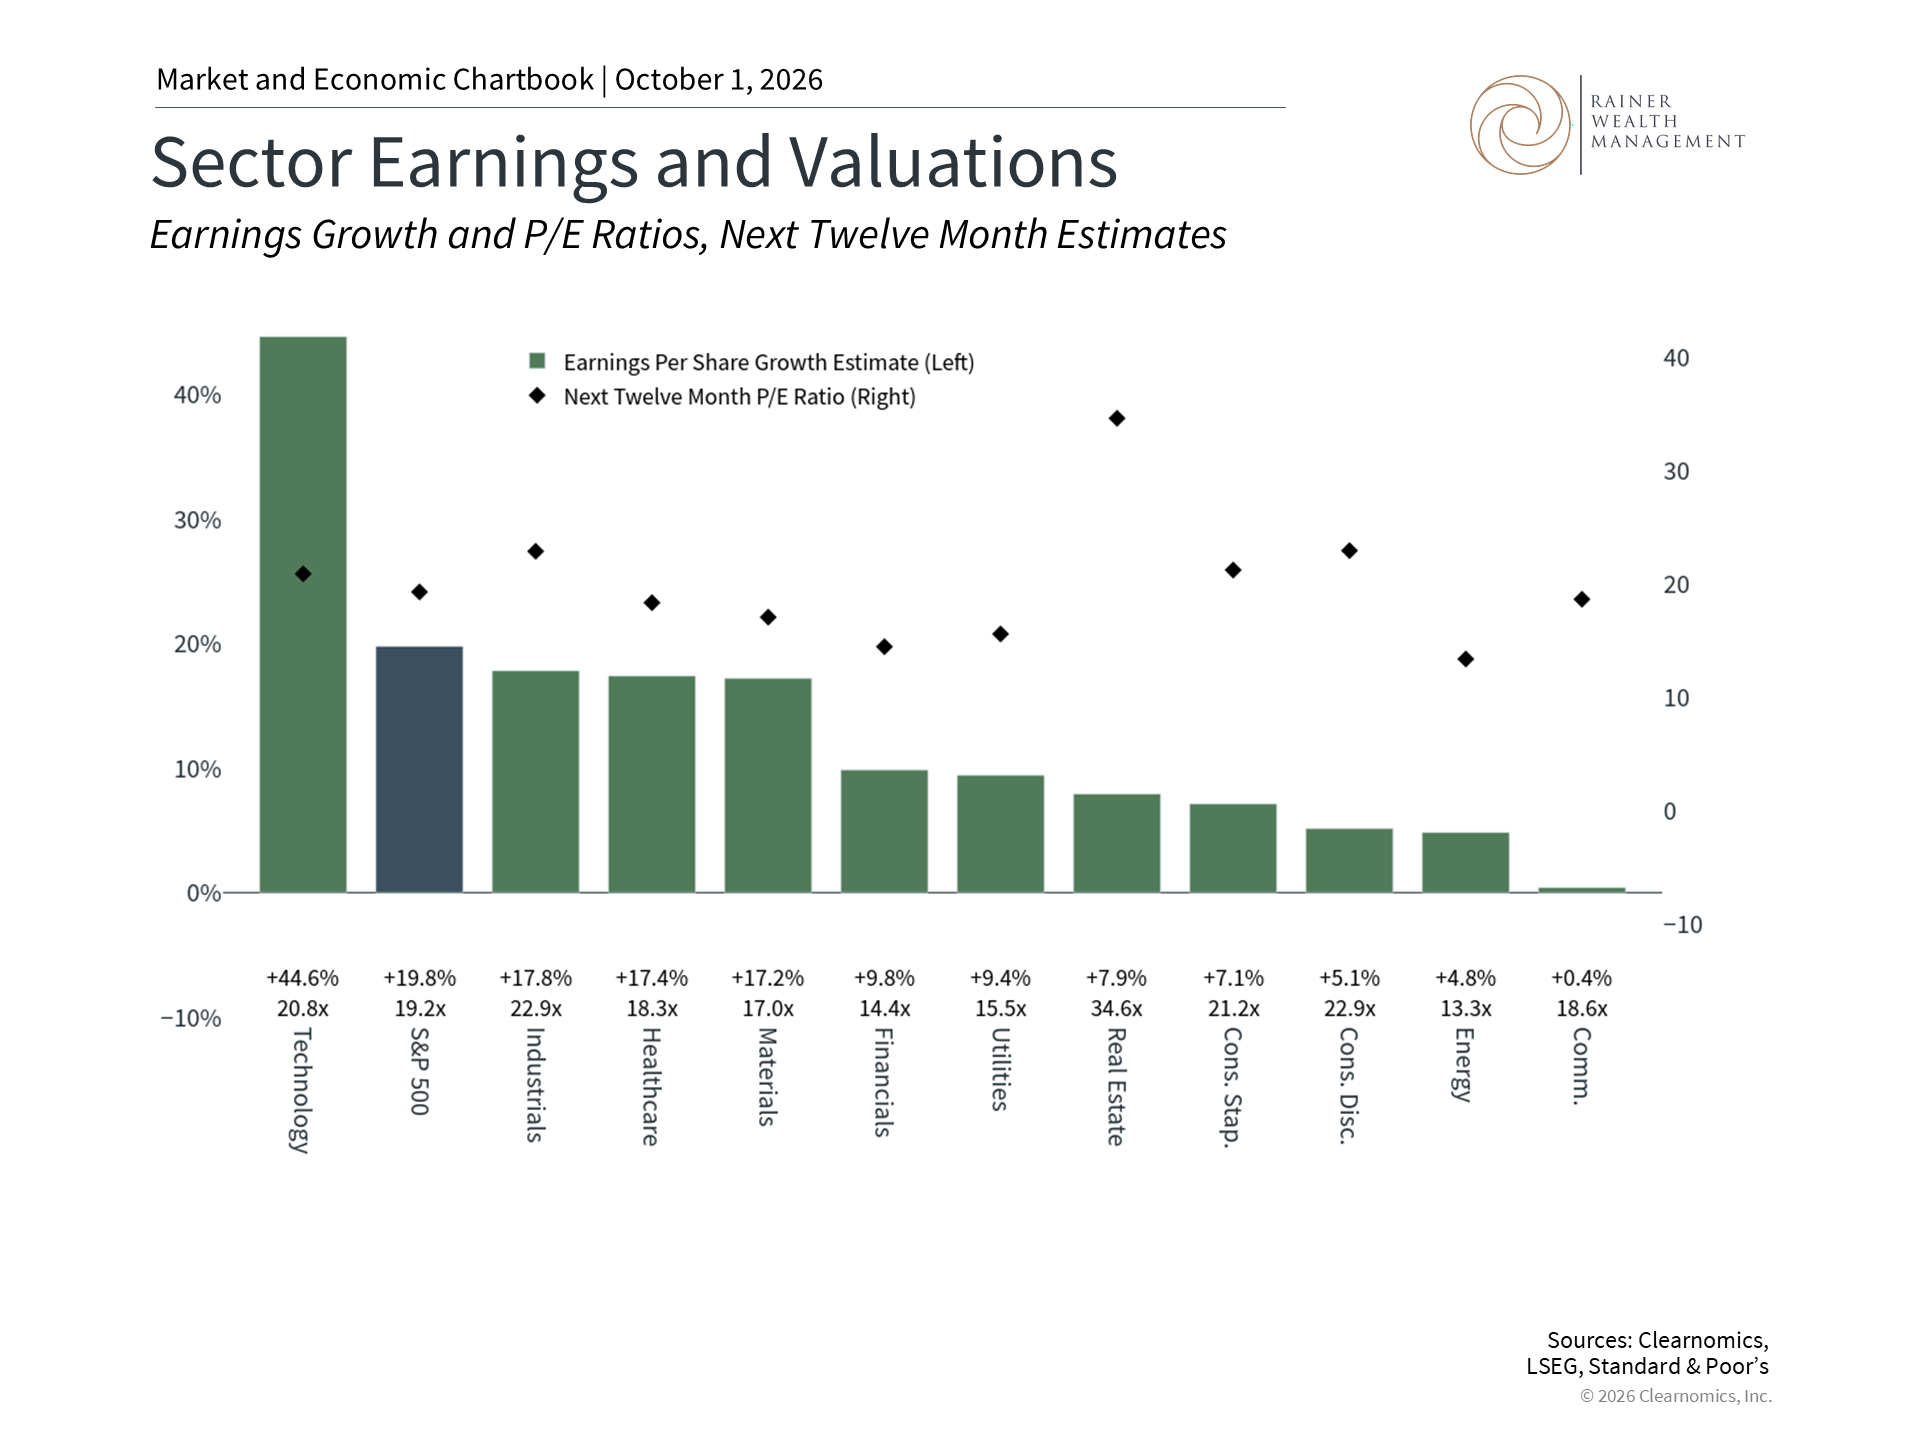
This chart shows the next twelve months earnings growth and P/E ratios for each S&P 500 sector. Sectors are ordered from highest earnings per share growth estimate, denoted by the bars. The black triangles show the next twelve-months P/E ratio. The levels are noted above the sector labels.
AI and other technology trends have been major forces behind the market's performance over the past decade. Not only have these themes driven returns for groups such as the Magnificent 7, but they have directly driven the fundamental earnings trends across sectors. The chart above, for instance, shows the difference in earnings growth between Information Technology and the other ten S&P 500 sectors.11
This “concentration risk” is a source of concern for some investors who worry that the market is increasingly driven by only a few stocks. While many technology-related areas of the market continue to perform well, it’s also the case that other sectors have contributed to healthy returns over the past year. These sectors are experiencing earnings growth that is well above average as well, which supports their stock prices. The energy sector, for instance, has benefited from higher oil prices, and is the best performing sector with a 37.4% year-to-date gain through the third quarter.
Much of the growth from AI trends is related to the building of infrastructure, including data centers. Perhaps the most important question continues to be whether AI will result in true productivity growth across companies. After all, the main benefit of the information technology revolution and the widespread adoption of the internet was a boost to productivity. So far, the 2020s have experienced average productivity growth of 2.1% per year, compared to only 1.2% in the 2010s. Whether AI and other new technologies will help to boost this is an open question that will likely affect markets and the economy in the coming years.
Given these challenges, maintaining a longer-term perspective continues to be important. The largest technology companies, for instance, took decades to get to where they are today, even if there was significant market enthusiasm in the 1990s. Similarly, understanding how these trends interact with higher interest rates and a new Fed rate hike cycle can help investors stay focused in the final quarter of the year.
The bottom line? Stocks reached new highs in the third quarter, with many asset classes contributing to portfolios, despite bonds struggling as interest rates rise. As new developments unfold and the midterm election approaches, investors should continue to stay balanced and focus on financial goals.
References
1. Return figures represent total returns with reinvested dividends. All figures as of September 30, 2026
2. Clearnomics research using Federal Reserve data, as of September 30, 2026
3. https://www.freddiemac.com/pmms
4. Clearnomics research using LSEG data, as of September 30, 2026
5. Clearnomics research using FTSE Russell and MSCI data, as of September 30, 2026
6. https://www.cmegroup.com/markets/interest-rates/cme-fedwatch-tool.html
7. Clearnomics research using Standard & Poor’s data, as of September 30, 2026
8. Clearnomics research using Standard & Poor’s data, as of September 30, 2026
9. https://fiscaldata.treasury.gov/americas-finance-guide/national-debt/
10. Clearnomics research using LSEG and Standard & Poor’s data, as of September 30, 2026
11. https://fiscaldata.treasury.gov/americas-finance-guide/national-deficit/https://fiscaldata.treasury.gov/americas-finance-guide/national-debt/
Index Descriptions
S&P 500
The Standard & Poor’s 500 Index is a capitalization-weighted index of 500 stocks designed to measure performance of the broad domestic economy through changes in the aggregate market value of 500 stocks representing all major industries. The modern design of the S&P 500 stock index was first launched in 1957. Performance prior to 1957 incorporates the performance of the predecessor index, the S&P 90.
Dow Jones
The Dow Jones Industrial Average consists of 30 stocks that are major factors in their industries and widely held by individuals and institutional investors.
NASDAQ
The NASDAQ Composite Index measures all NASDAQ domestic and non-U.S. based common stocks listed on The NASDAQ Stock Market. The market value, the last sale price multiplied by total shares outstanding, is calculated throughout the trading day, and is related to the total value of the Index.
MSCI Emerging Markets Index
The MSCI EM (Emerging Markets) Index is a free float-adjusted market capitalization weighted index that is designed to measure the equity market performance of the emerging market countries of the Americas, Europe, the Middle East, Africa and Asia. The MSCI EM Index consists of the following emerging market country indices: Brazil, Chile, Colombia, Mexico, Peru, Czech Republic, Egypt, Greece, Hungary, Poland, Qatar, Russia, South Africa, Turkey, United Arab Emirates, China, India, Indonesia, Korea, Malaysia, Philippines, Taiwan, and Thailand.
MSCI EAFE Index
The MSCI EAFE Index is a free float-adjusted market capitalization index that is designed to measure the equity market performance of developed markets, excluding the US & Canada. The MSCI EAFE Index consists of the following developed country indices: Australia, Austria, Belgium, Denmark, Finland, France, Germany, Hong Kong, Ireland, Israel, Italy, Japan, the Netherlands, New Zealand, Norway, Portugal, Singapore, Spain, Sweden, Switzerland and the UK.
Bloomberg US Aggregate Bond Index
The Bloomberg U.S. Aggregate Bond Index is an index of the U.S. investment-grade fixed-rate bond market, including both government and corporate bonds.
DXY
The DXY is a U.S. dollar index based on a basket of currencies, including the Euro, Yen, Pound, Canadian Dollar, Swedish Krona and Swiss Franc.
For more information or to schedule a consultation, please give us a call at (925) 217-4280.
Trice C. Rainer, MBA, CFP®
Elizabeth Mintzer, CFP®
390 Diablo Road, Suite 202, Danville, CA 94526
Clearnomics Partnership Disclosure: We have partnered with Clearnomics to create and distribute economic and market commentary. Material presented in economic updates encompass contributions from both Rainer Wealth Management & Clearnomics.
Securities offered through Registered Representatives of Cambridge Investment Research, a broker/dealer, Member FINRA/SIPC. Advisory services through Cambridge Investment Research Advisors, Inc., a Registered Investment Adviser. Cambridge, Protected Investors of America and Rainer Wealth Management are not affiliated. Registered for Securities in CA, OH, TX, WA.