

Monthly Market Update for October 2026: AI Volatility, the Fed Hawkish Hold, and Strong GDP Growth
Provided by Rainer Wealth Management
The stock market experienced volatility in October amid strong year-to-date gains. Major indices delivered mixed results for the month, driven by declines in technology stocks. At the same time, the bond market experienced gains in many areas as long-term interest rates pulled back from their recent highs. Overall, these moves were driven by investors reassessing trends around artificial intelligence, interest rates, the Federal Reserve, and more.
Specifically, markets grappled with questions about whether AI investments will generate meaningful financial returns, how higher energy-driven inflation is shaping Fed policy decisions, and whether consumer and business spending can continue to support the broader economy.
These are not new concerns. In fact, many of these trends reflect themes that have both supported markets and occasionally introduced volatility this year. For that reason, maintaining a long-term perspective and avoiding overreactions to short-term movements remains as important as ever.
What drove markets in October, and what should investors keep in mind as they look ahead?
Key Market and Economic Drivers in October
• The S&P 500 and Nasdaq fell -0.9% and -5.3%, respectively, while the Dow Jones Industrial Average rose 1.7% in October. Year-to-date, they have gained 10.7%, 9.4%, and 7.7%, respectively.
• Volatility, as measured by the CBOE VIX index, ended the month at 19.4, after falling as low as 14.2 in September.
• International developed markets returned -0.8% based on the MSCI EAFE Index in U.S. dollar terms, while emerging markets returned -8.1% based on the MSCI EM Index.
• The 30-year Treasury yield fell from its recent highs, closing the month at 5.31%. The 10-year Treasury yield ended the month at 4.93%, falling below 5%. The Bloomberg U.S. Aggregate Bond Index returned 2.4% for the month.
• Oil prices rose significantly in October, driven by renewed geopolitical tensions in the Middle East. Brent crude closed the month at $118 per barrel and WTI just below $103.
• The U.S. Dollar Index fell to 101.9 at the end of October. Gold ended the month at $3,873 per ounce, a recent low.
• The Fed held rates within the range of 3.75% to 4.00% at its October meeting, with two officials favoring a 25-basis point increase.
Investors are assessing AI spending amid strong earnings
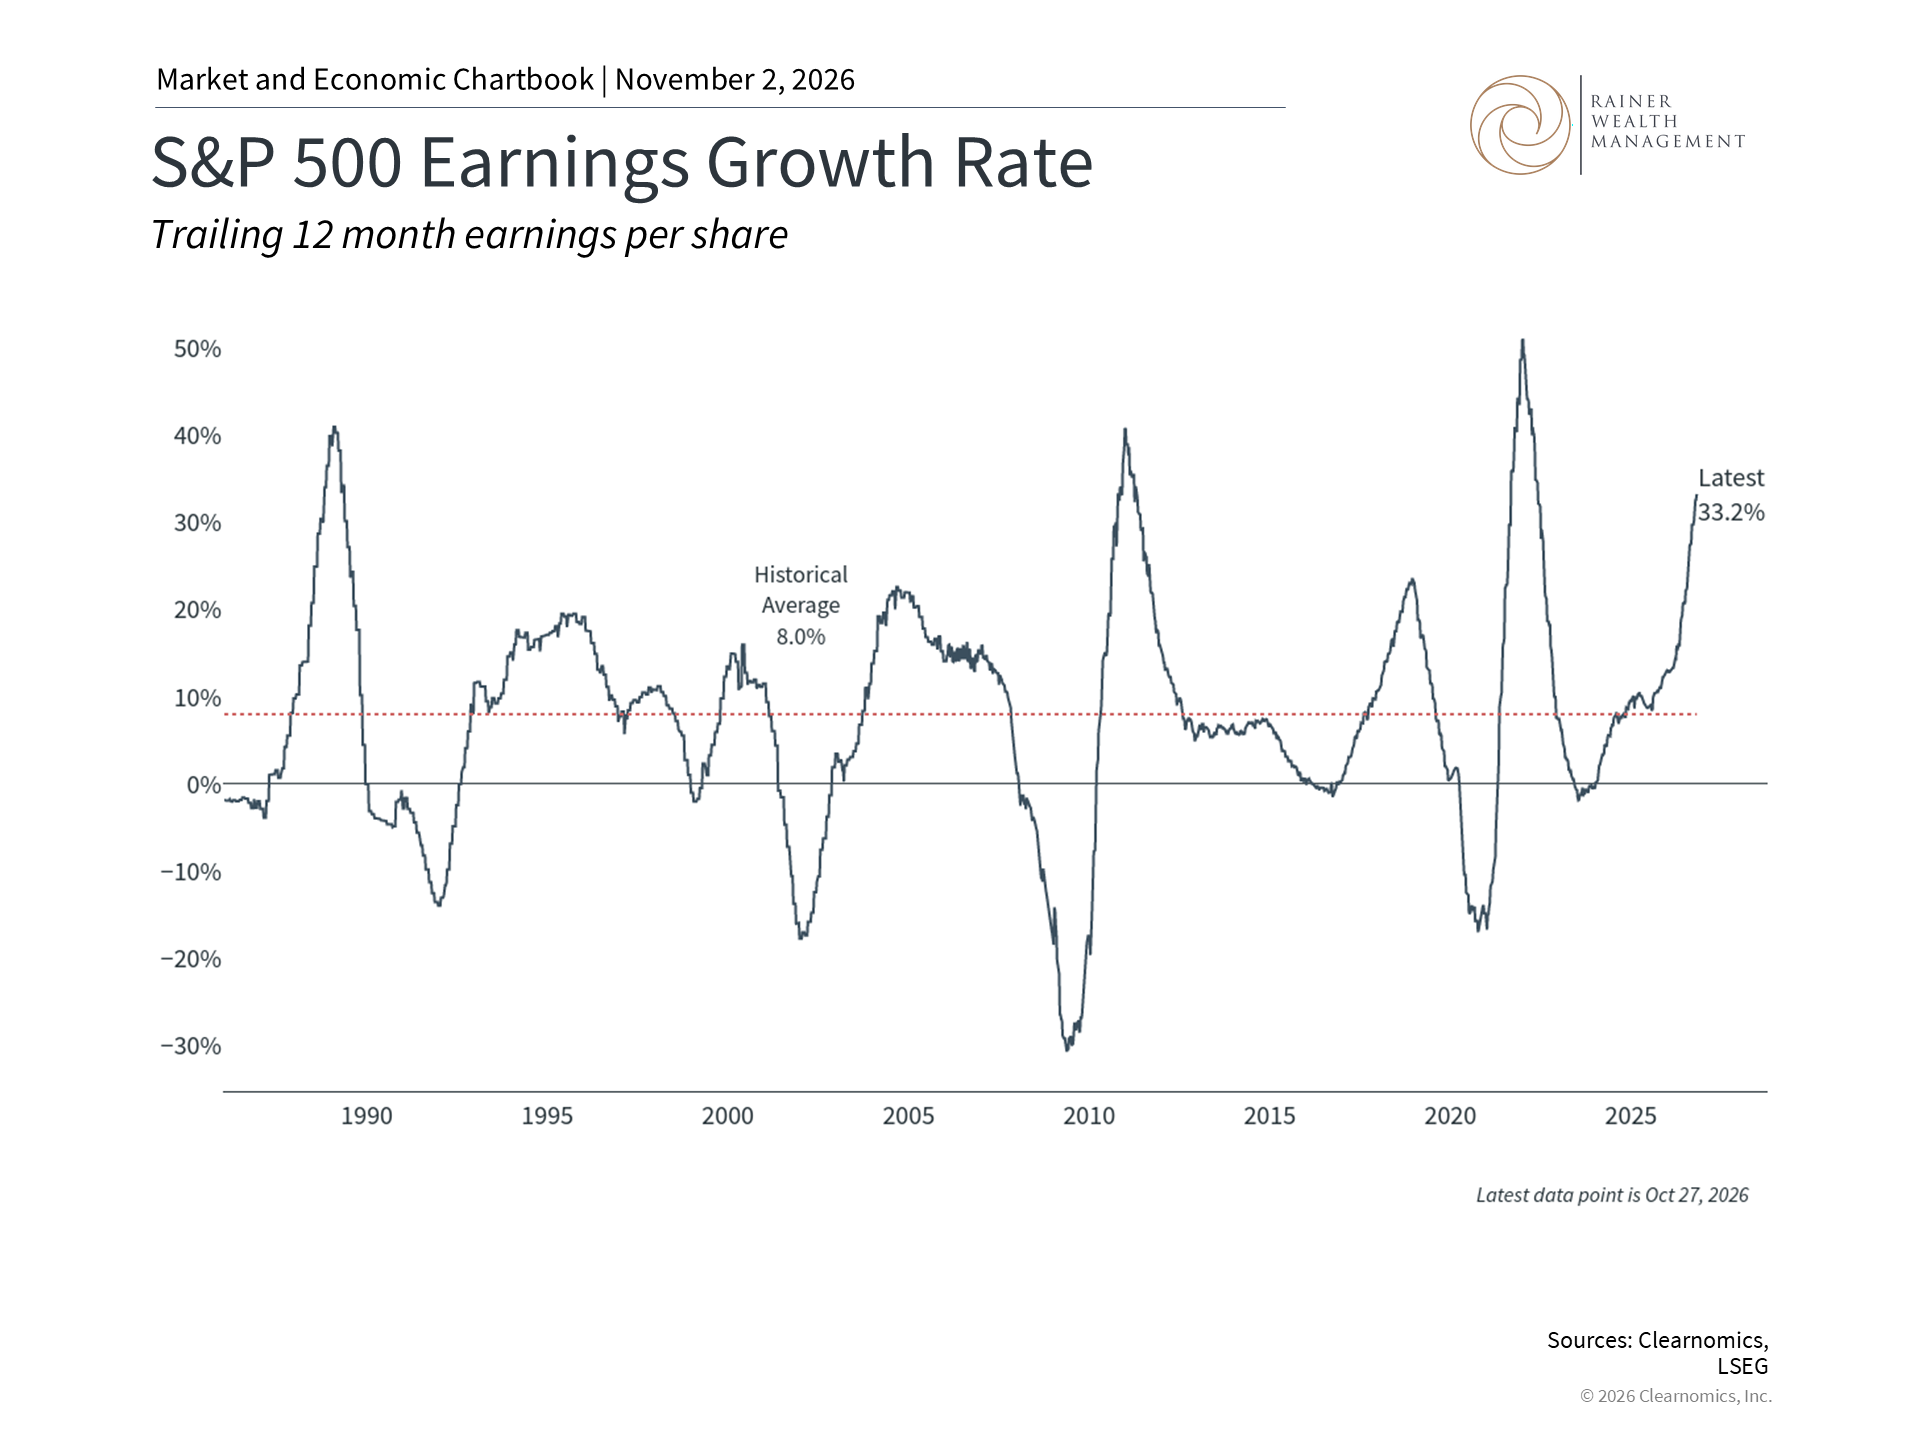
This chart tracks the year-over-year growth rate of S&P 500 12-month trailing earnings per share.
It’s no secret that AI has been a central theme for financial markets in recent years. Today, these trends are supporting both business investment and market returns. However, this is not due to greater productivity within companies or token usage, but mostly due to the buildout of AI infrastructure. This requires substantial spending on data centers, semiconductors, and the infrastructure needed to power them. While this has supported broad economic growth, it also means that cash flows for companies making these investments may look worse than investors would like.
This drove market swings throughout October since some large tech companies reported negative free cash flow due to these infrastructure investments which once again raises questions about whether investments of this magnitude will generate a sufficient return on investment.
At the same time, this level of spending supports many parts of the economy, including construction firms, electricity providers, equipment suppliers, semiconductor hardware, and more. This is one reason corporate earnings growth has accelerated in recent quarters, as seen in the chart above. Not only has this supported broad market returns and GDP growth, but it has helped to moderate stock market valuations as well. The forward price-to-earnings ratio for the S&P 500, for instance, has improved from a high of 23.3 a year ago to 18.9 today.1
That said, it is worth remembering that AI is only one of many factors driving markets. Technology stocks also tend to be sensitive to interest rates, since their cash flows are projected to occur far into the future. So, trends around long-term interest rates, the Fed’s latest decision, and other factors can affect these sectors and the broader market as well. As investors continue to gauge the long-term economic impact of AI, staying balanced across sectors, styles, and geographies remains an important part of achieving financial goals.
The Fed's hawkish hold
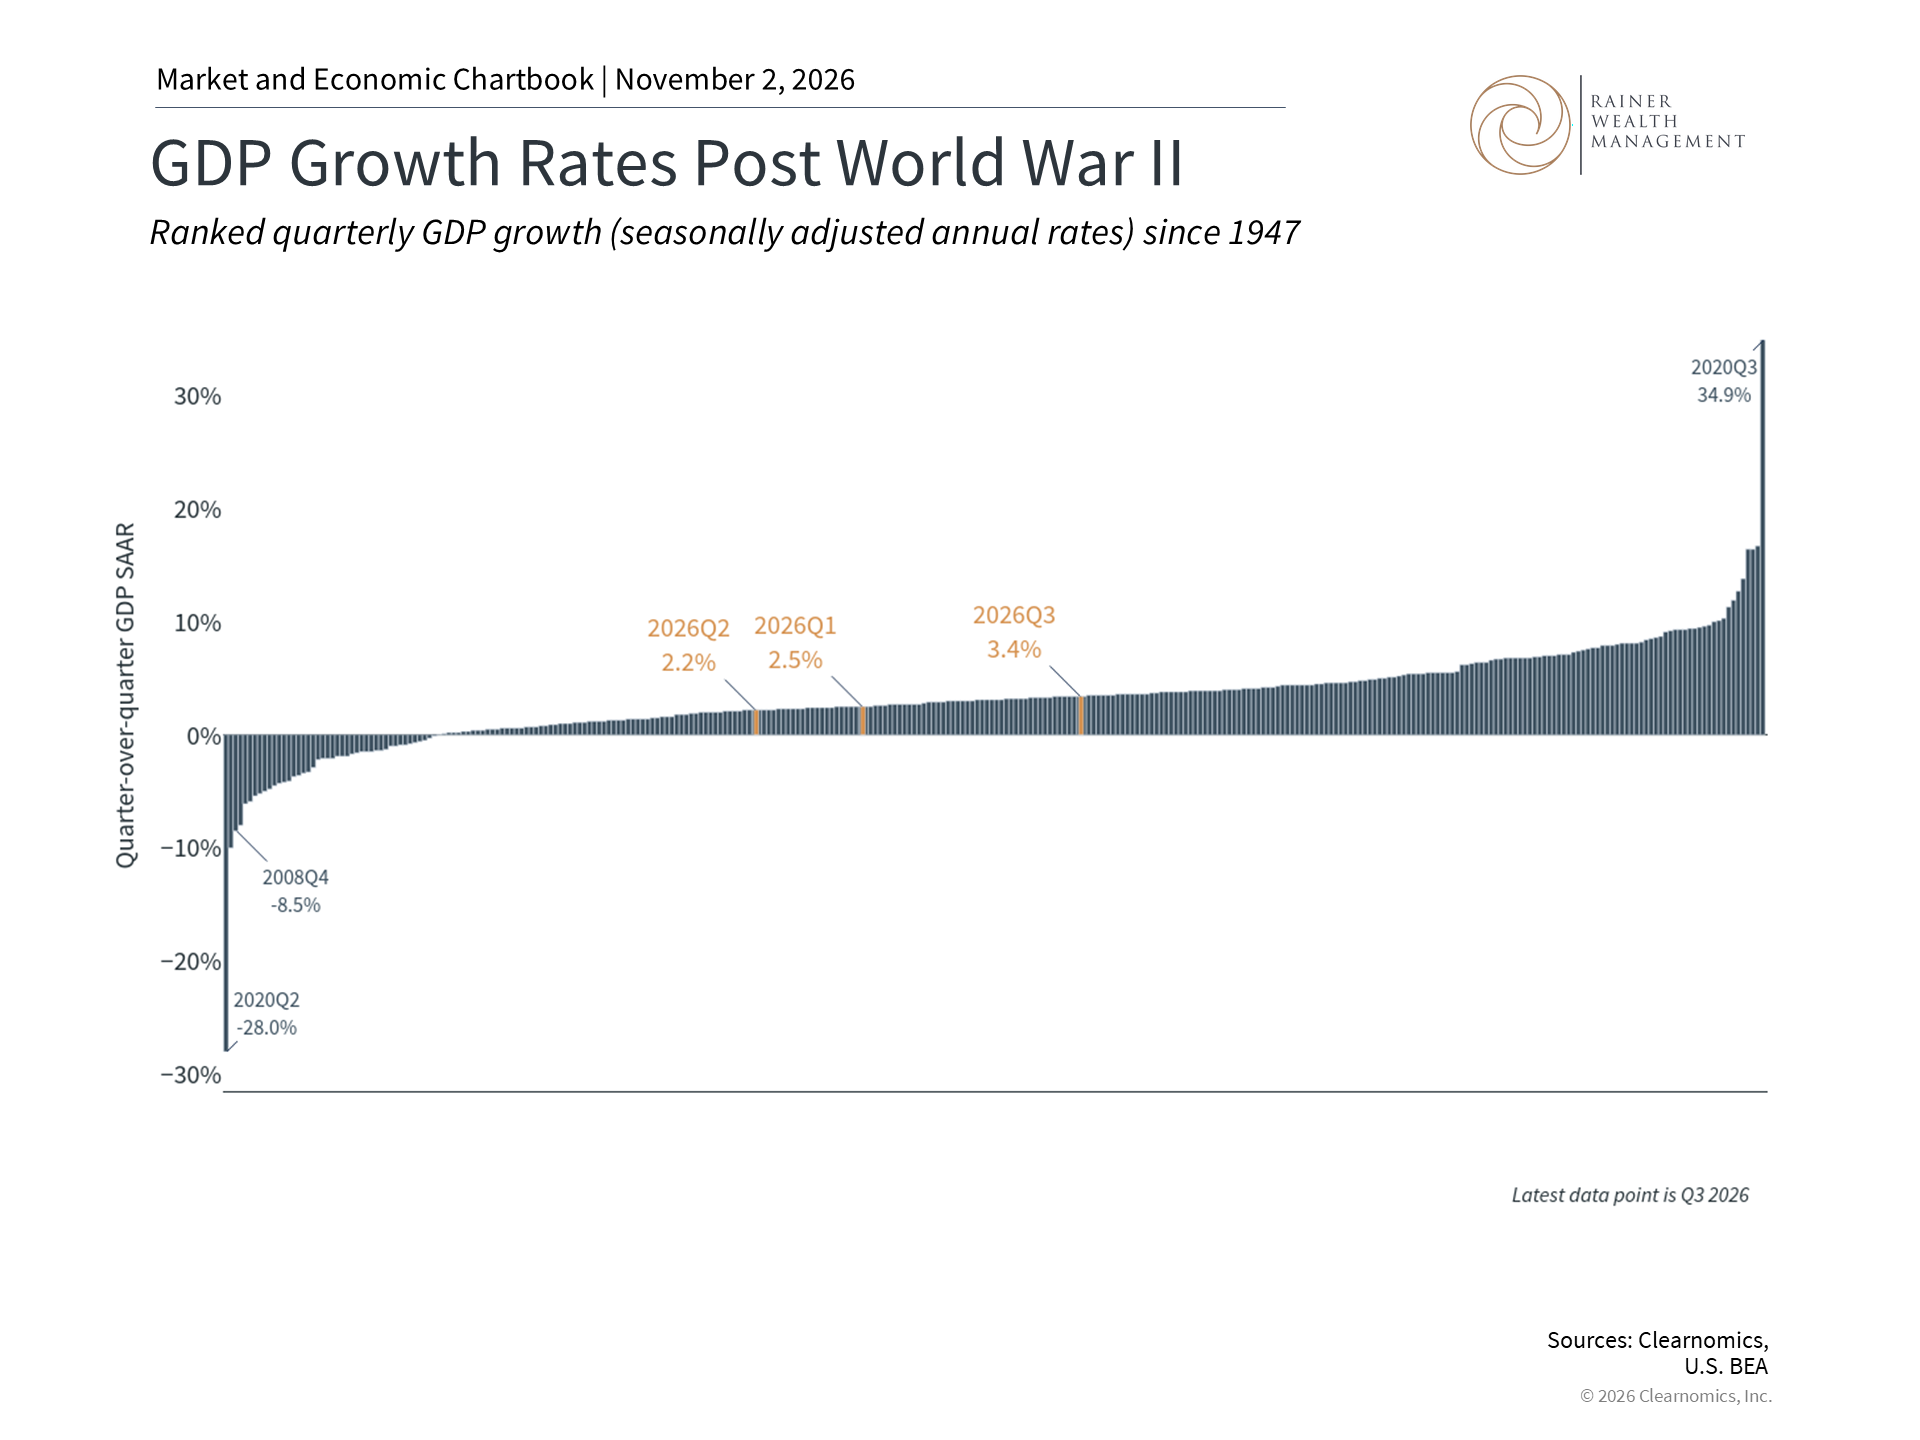
This chart shows quarterly GDP growth rates on a seasonally adjusted annual rate (SAAR). The quarterly SAAR growth rates ranked from lowest to highest.
Higher energy prices remained a challenge in October as tensions in the Middle East intensified. According to the International Maritime Organization, October marked the highest number of commercial shipping attacks on record in the Strait of Hormuz and surrounding waterways, even though more shipments are now flowing through these waterways.2 Continued attacks on Saudi Arabian energy infrastructure added to supply concerns as well. In response, Brent crude, the global benchmark, rose to a six-month high near $118 per barrel, while WTI reached approximately $103.
Against this backdrop, inflation has remained higher than economists and policymakers would prefer. The Personal Consumption Expenditures (PCE) price index rose 0.5% in September and 3.6% from a year earlier. Core PCE, which excludes volatile food and energy prices, increased 0.3% for the month and 3.1% from a year earlier.3 Inflation has now remained above the Fed's 2% target for 67 months and is near a three-year high.
This is why the Fed’s decision in October to keep its policy rate unchanged at 3.75% to 4.00% has been referred to as a “hawkish hold.” While they did not change the federal funds rate, they are expected to raise rates at the last FOMC meeting this year, and possibly one more time in 2027.4 In fact, the decision to hold rates was based on a 10 to 2 vote, with two FOMC officials preferring to raise rates by a quarter-point.5 The official statement described economic activity as expanding at a strong pace, while noting that additional information would help determine the appropriate policy stance.
Fed Chair Kevin Warsh also announced a change to the Fed's meeting schedule. The Fed will still meet eight times in 2027, but one meeting will focus exclusively on broader monetary policy strategy, without a rate vote or official statement. While there is no immediate impact on investors, it does mean there will be fewer announcements that the market can react to next year.
Economic growth strengthened despite weak consumer sentiment
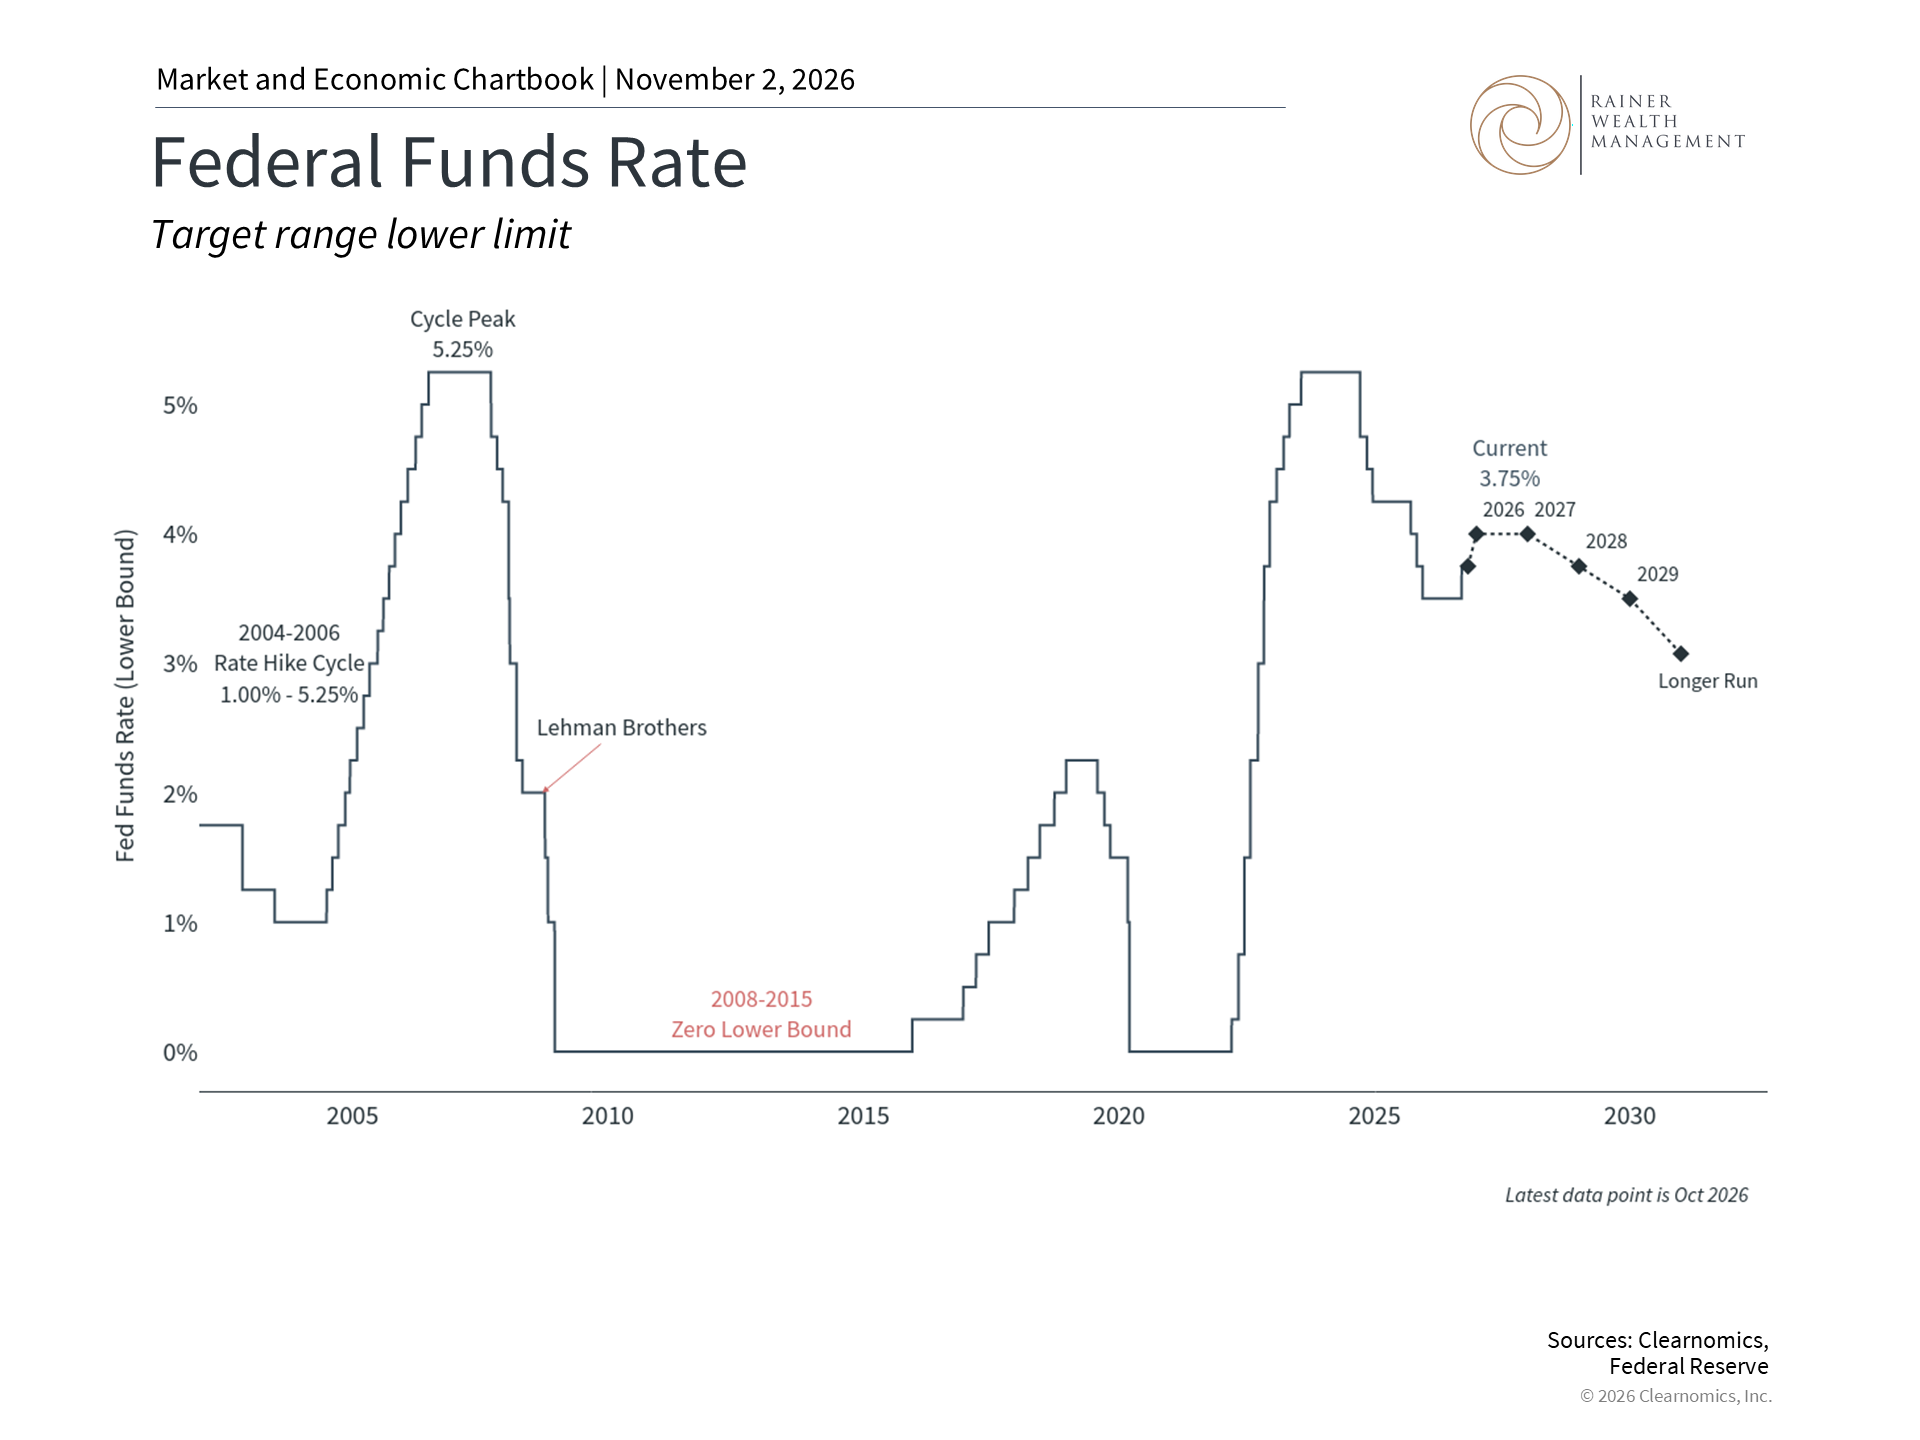
This chart tracks the Federal Funds Rate lower limit. The dotted lines indicate the Federal Open Market Committee's (FOMC) participants' median assessments of appropriate path for the Federal Funds Rate, based on the Summary of Economic Projections.
An important economic report released in October showed that the economy grew more quickly in the third quarter than expected. According to the Bureau of Economic Analysis, real GDP grew at a 3.4% annualized rate in the third quarter.6 This was the strongest quarterly growth since the third quarter last year, and as the chart above shows, this is a healthy figure when compared to historical growth rates.
This was driven largely by strong consumer spending growth of 2.5% and business investment which rose 3.3%. Government spending only increased 0.9% while net exports fell -3.3%. This is because imports exceeded exports over this period, which detracts from GDP.7
Consumer spending has been strong in recent quarters even though sentiment remains weak. On the one hand, households continue to worry about inflation and the job market, driving their confidence in the economy to historic lows. On the other hand, spending remains strong, possibly due to the overall positive trends in financial markets and low unemployment rates.
Business investment rose sharply in part due to the AI data center buildout. This also explains the drop in net exports since data centers and other AI infrastructure require semiconductor hardware imported from other countries. Combined, these led to a positive jump in economic growth.
Together, these factors reflect a healthy economy with a low jobless rate, but with inflation that remains stickier due to higher energy prices. The reality is that no economic environment is perfect, and investors must always navigate new uncertainties and challenges. Today’s environment is supporting strong earnings growth, which in the long run is positive for financial markets and portfolios. Thus, it’s important for investors to maintain a longer-term perspective and not overreact to news headlines or individual earnings reports.
The bottom line? October brought volatility due to questions around AI spending, energy-driven inflation, and Fed policy. Staying balanced and focused on long-term goals, rather than reacting to monthly headlines, remains the most important principle for investors navigating today's environment.
References
1. Clearnomics research using S&P 500 data, as of October 30, 2026
2. https://www.imo.org/en/mediacentre/hottopics/pages/middle-east-highlighted-incidents.aspx
3. https://www.bea.gov/news/2026/personal-income-and-outlays-september-2026
4. https://www.cmegroup.com/markets/interest-rates/cme-fedwatch-tool
5. https://www.federalreserve.gov/monetarypolicy/files/monetary20261028a1.pdf
6. https://www.bea.gov/news/2026/gdp-advance-estimate-3rd-quarter-2026
7. https://www.bea.gov/news/2026/gdp-advance-estimate-3rd-quarter-2026
Index Descriptions
S&P 500
The Standard & Poor’s 500 Index is a capitalization-weighted index of 500 stocks designed to measure performance of the broad domestic economy through changes in the aggregate market value of 500 stocks representing all major industries.
The modern design of the S&P 500 stock index was first launched in 1957. Performance prior to 1957 incorporates the performance of the predecessor index, the S&P 90.
Dow Jones
The Dow Jones Industrial Average consists of 30 stocks that are major factors in their industries and widely held by individuals and institutional investors.
NASDAQ
The NASDAQ Composite Index measures all NASDAQ domestic and non-U.S. based common stocks listed on The NASDAQ Stock Market. The market value, the last sale price multiplied by total shares outstanding, is calculated throughout the trading day, and is related to the total value of the Index.
MSCI Emerging Markets Index
The MSCI EM (Emerging Markets) Index is a free float-adjusted market capitalization weighted index that is designed to measure the equity market performance of the emerging market countries of the Americas, Europe, the Middle East, Africa and Asia. The MSCI EM Index consists of the following emerging market country indices: Brazil, Chile, Colombia, Mexico, Peru, Czech Republic, Egypt, Greece, Hungary, Poland, Qatar, Russia, South Africa, Turkey, United Arab Emirates, China, India, Indonesia, Korea, Malaysia, Philippines, Taiwan, and Thailand.
MSCI EAFE Index
The MSCI EAFE Index is a free float-adjusted market capitalization index that is designed to measure the equity market performance of developed markets, excluding the US & Canada. The MSCI EAFE Index consists of the following developed country indices: Australia, Austria, Belgium, Denmark, Finland, France, Germany, Hong Kong, Ireland, Israel, Italy, Japan, the Netherlands, New Zealand, Norway, Portugal, Singapore, Spain, Sweden, Switzerland and the UK.
Bloomberg US Aggregate Bond Index
The Bloomberg U.S. Aggregate Bond Index is an index of the U.S. investment-grade fixed-rate bond market, including both government and corporate bonds.
DXY
The DXY is a U.S. dollar index based on a basket of currencies, including the Euro, Yen, Pound, Canadian Dollar, Swedish Krona and Swiss Franc.
For more information or to schedule a consultation, please give us a call at (925) 217-4280
Trice C. Rainer, MBA, CFP®
Elizabeth Mintzer, CFP®
390 Diablo Road, Suite 202, Danville, CA 94526
Clearnomics Partnership Disclosure: We have partnered with Clearnomics to create and distribute economic and market commentary. Material presented in economic updates encompass contributions from both Rainer Wealth Management & Clearnomics.
Securities offered through Registered Representatives of Cambridge Investment Research, a broker/dealer, Member FINRA/SIPC. Advisory services through Cambridge Investment Research Advisors, Inc., a Registered Investment Adviser. Cambridge, Protected Investors of America and Rainer Wealth Management are not affiliated. Registered for Securities in CA, OH, TX, WA.