

The Bull Market Cycle: Investment Lessons and the Wall of Worry
Provided by Rainer Wealth Management
It has now been more than three-and-a-half years since the bull market began in October 2022. At that time, inflation was rising at its fastest pace in fifty years, the Fed was hiking interest rates, and ChatGPT was still a month away from being released to the public. Since then, the S&P 500 has more than doubled in value and the Bloomberg U.S. Aggregate Bond index has fully recovered.
Although the world has changed since then, the fact that there are market concerns in the headlines has not. Each cycle brings new challenges and questions about whether the tried-and-true rules of investing are still relevant. The reality is that each cycle is unique, with catalysts, innovations, and sources of uncertainty that are never quite the same. And yet, the underlying principles of investing and financial planning have remained consistent across decades, and have continued to point investors in the right direction this year.
Bull markets climb a wall of worry
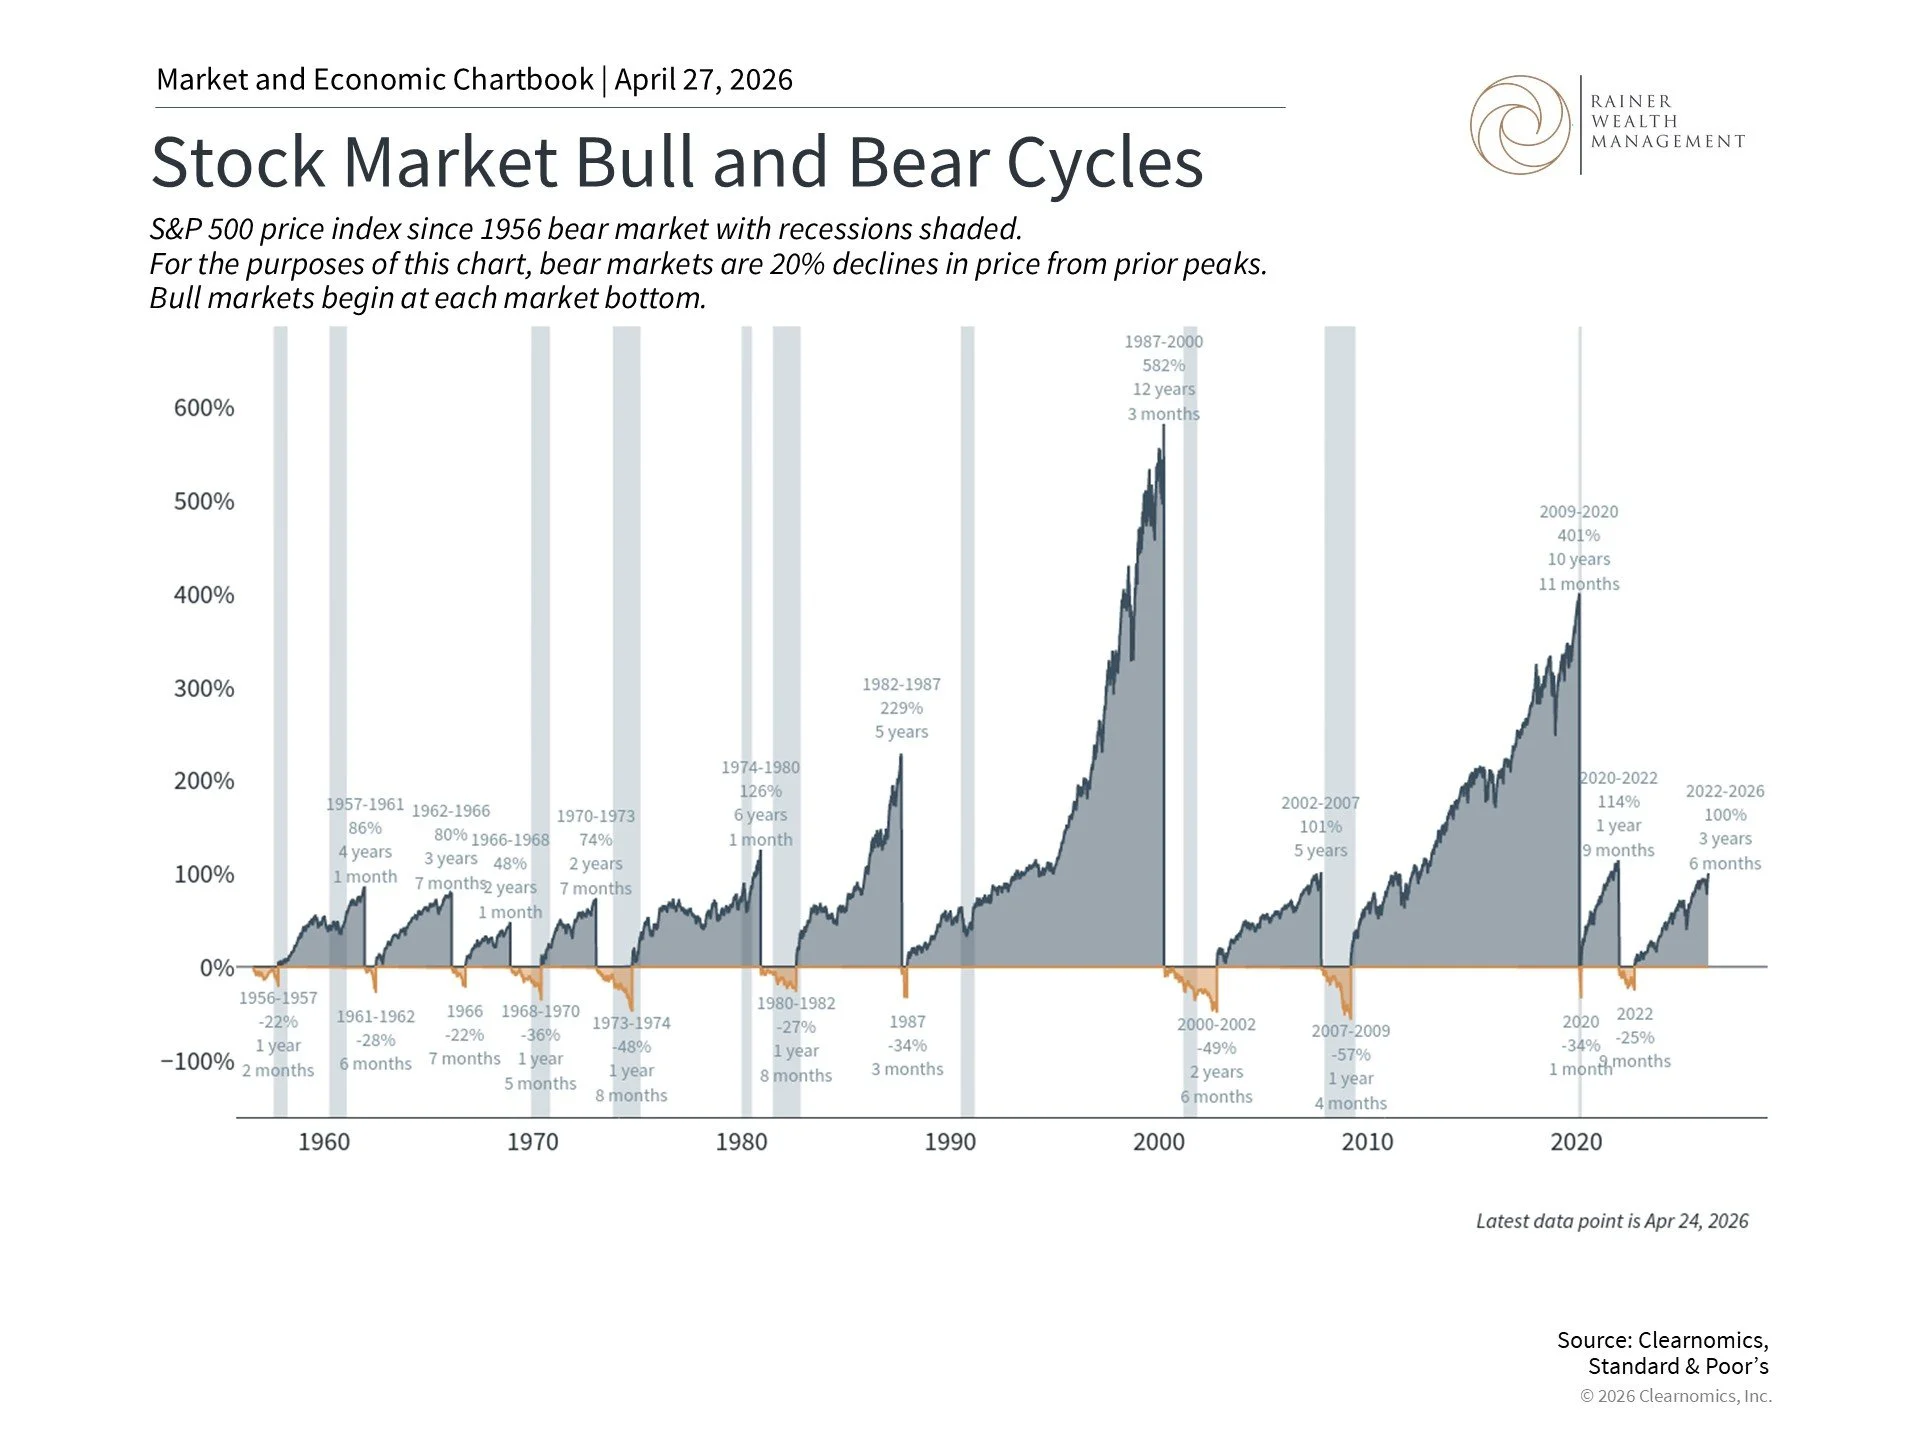
This chart shows the S&P 500 price index with the start of bull and bear markets adjusted to zero. The returns for each period show the relative price returns from the start of the bear or bull market to the end of the market cycle. Bear markets are defined as declines from the prior highest market level that extend beyond -20%. Subsequent bull markets begin from each bear market bottom.
Even though geopolitics continue to impact markets, perhaps the more important consideration for long-term investors is the overall market cycle. With the market hovering near all-time highs, it’s natural for some investors to worry about market pullbacks and corrections. After all, these events can occur frequently, with the S&P 500 historically experiencing four or five pullbacks of 5% or worse each year, on average.1 While they are never pleasant, long-term investing depends much more on historical patterns over years and decades. This is one reason that overreacting to market swings can be counterproductive, since it may leave investors poorly positioned in the context of their long-term financial goals.
Investors often say that the market climbs a “wall of worry” on a regular basis. Over the past several years, markets have overcome high inflation, a banking crisis in 2023, geopolitical conflicts, the possibility of a Fed policy error, AI-related market concentration, tariff-driven volatility, and much more. None of these concerns are trivial and yet, through all of them, the market has performed well.
The chart above helps to illustrate this pattern starting from World War II. Over this 70-year period, bull markets have lasted far longer and generated larger gains than what’s lost in bear markets. Specifically, bear markets have typically lasted one to two years on average, whereas recent bull markets have run as long as ten years or longer. Even when market corrections occur during bull markets, the average decline is 14%, with the average recovery requiring just four months.2
For instance, the bull market cycle that followed the 2008 financial crisis lasted nearly eleven years. Despite this, it is often referred to as “the most unloved bull market” since there was a constant stream of market and economic concerns. In hindsight, it’s easy to see that even when these concerns were legitimate, such as around the state of the economic recovery or the size of the national debt, they didn’t justify changes to long-term portfolios.
Of course, the past is no guarantee of future results, and how quickly markets rebound depends on the specific circumstances. But the historical record makes it clear that trying to react to every market move has, more often than not, caused investors to miss much of the gains that eventually followed.
A growing economy is the foundation for long run returns
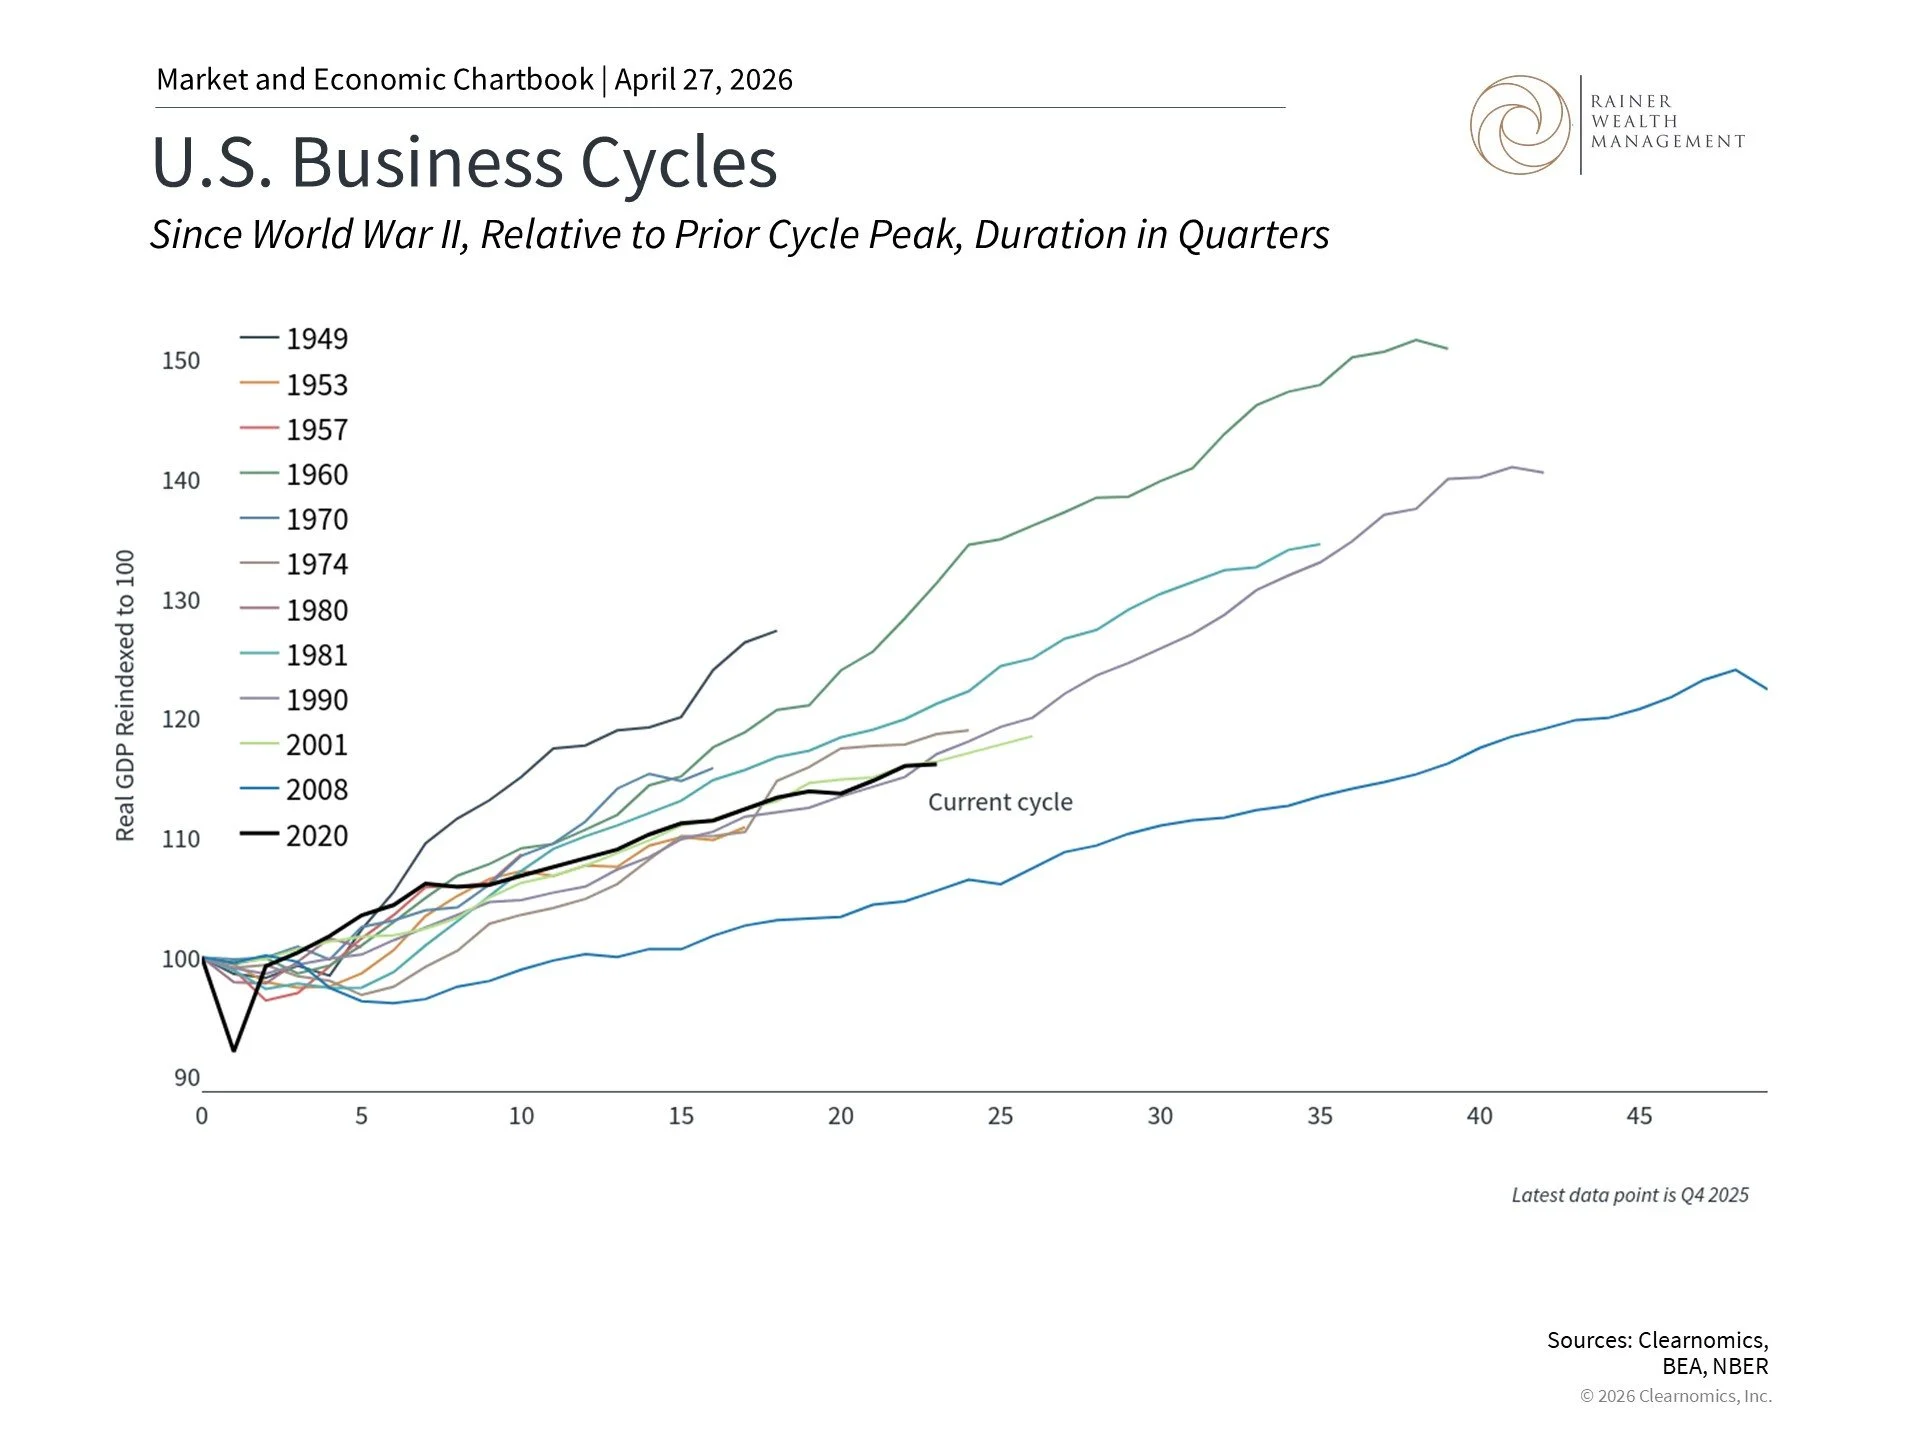
This chart shows the progression of real GDP throughout U.S. business cycles since World War II. For each cycle, real GDP is reindexed to 100 at the prior cycle peak. Changes from 100 at the prior cycle peak can be interpreted as percentage changes. Note the 2020 recession and current cycle are included with the 2008 expansion for clarity.
While the stock market and the economy are not the same thing, they are connected. Corporate earnings drive stock prices in the long run and ultimately depend on economic growth. This is why it is important to keep an eye on the broader economic cycle, even as markets move on a day-to-day basis for many other reasons.
The current business cycle has technically been running two-and-a-half years longer than the market cycle. The last official recession, as determined by the National Bureau of Economic Research, was the brief but sharp response to the pandemic in 2020. Since then, there have been quarters of slower growth and occasional predictions about recessions, none of which have taken shape.
Today, the economy is healthy by many measures despite three key areas that investors are watching carefully. First, oil prices above $100 per barrel, if sustained, could weigh on consumer spending and add to inflationary pressures. Second, the job market has slowed significantly, especially in areas such as technology. This raises questions about consumer spending, which has been robust over the past several years. Third, the size and scale of AI investments have raised questions about whether there is a “bubble.” This is understandable since many of today’s investors have lived through both the dot-com bust and the housing crisis.
Bubbles are notoriously difficult to identify in real time, and history shows that not every period of high valuations ends in a dramatic collapse. So far in this cycle, unlike in past periods, earnings growth has supported valuations and many companies are making outsized investments out of their profits. For long-term investors, the key consideration is staying balanced across different parts of the market to benefit from growth while managing risk.
Stocks and bonds continue to work together
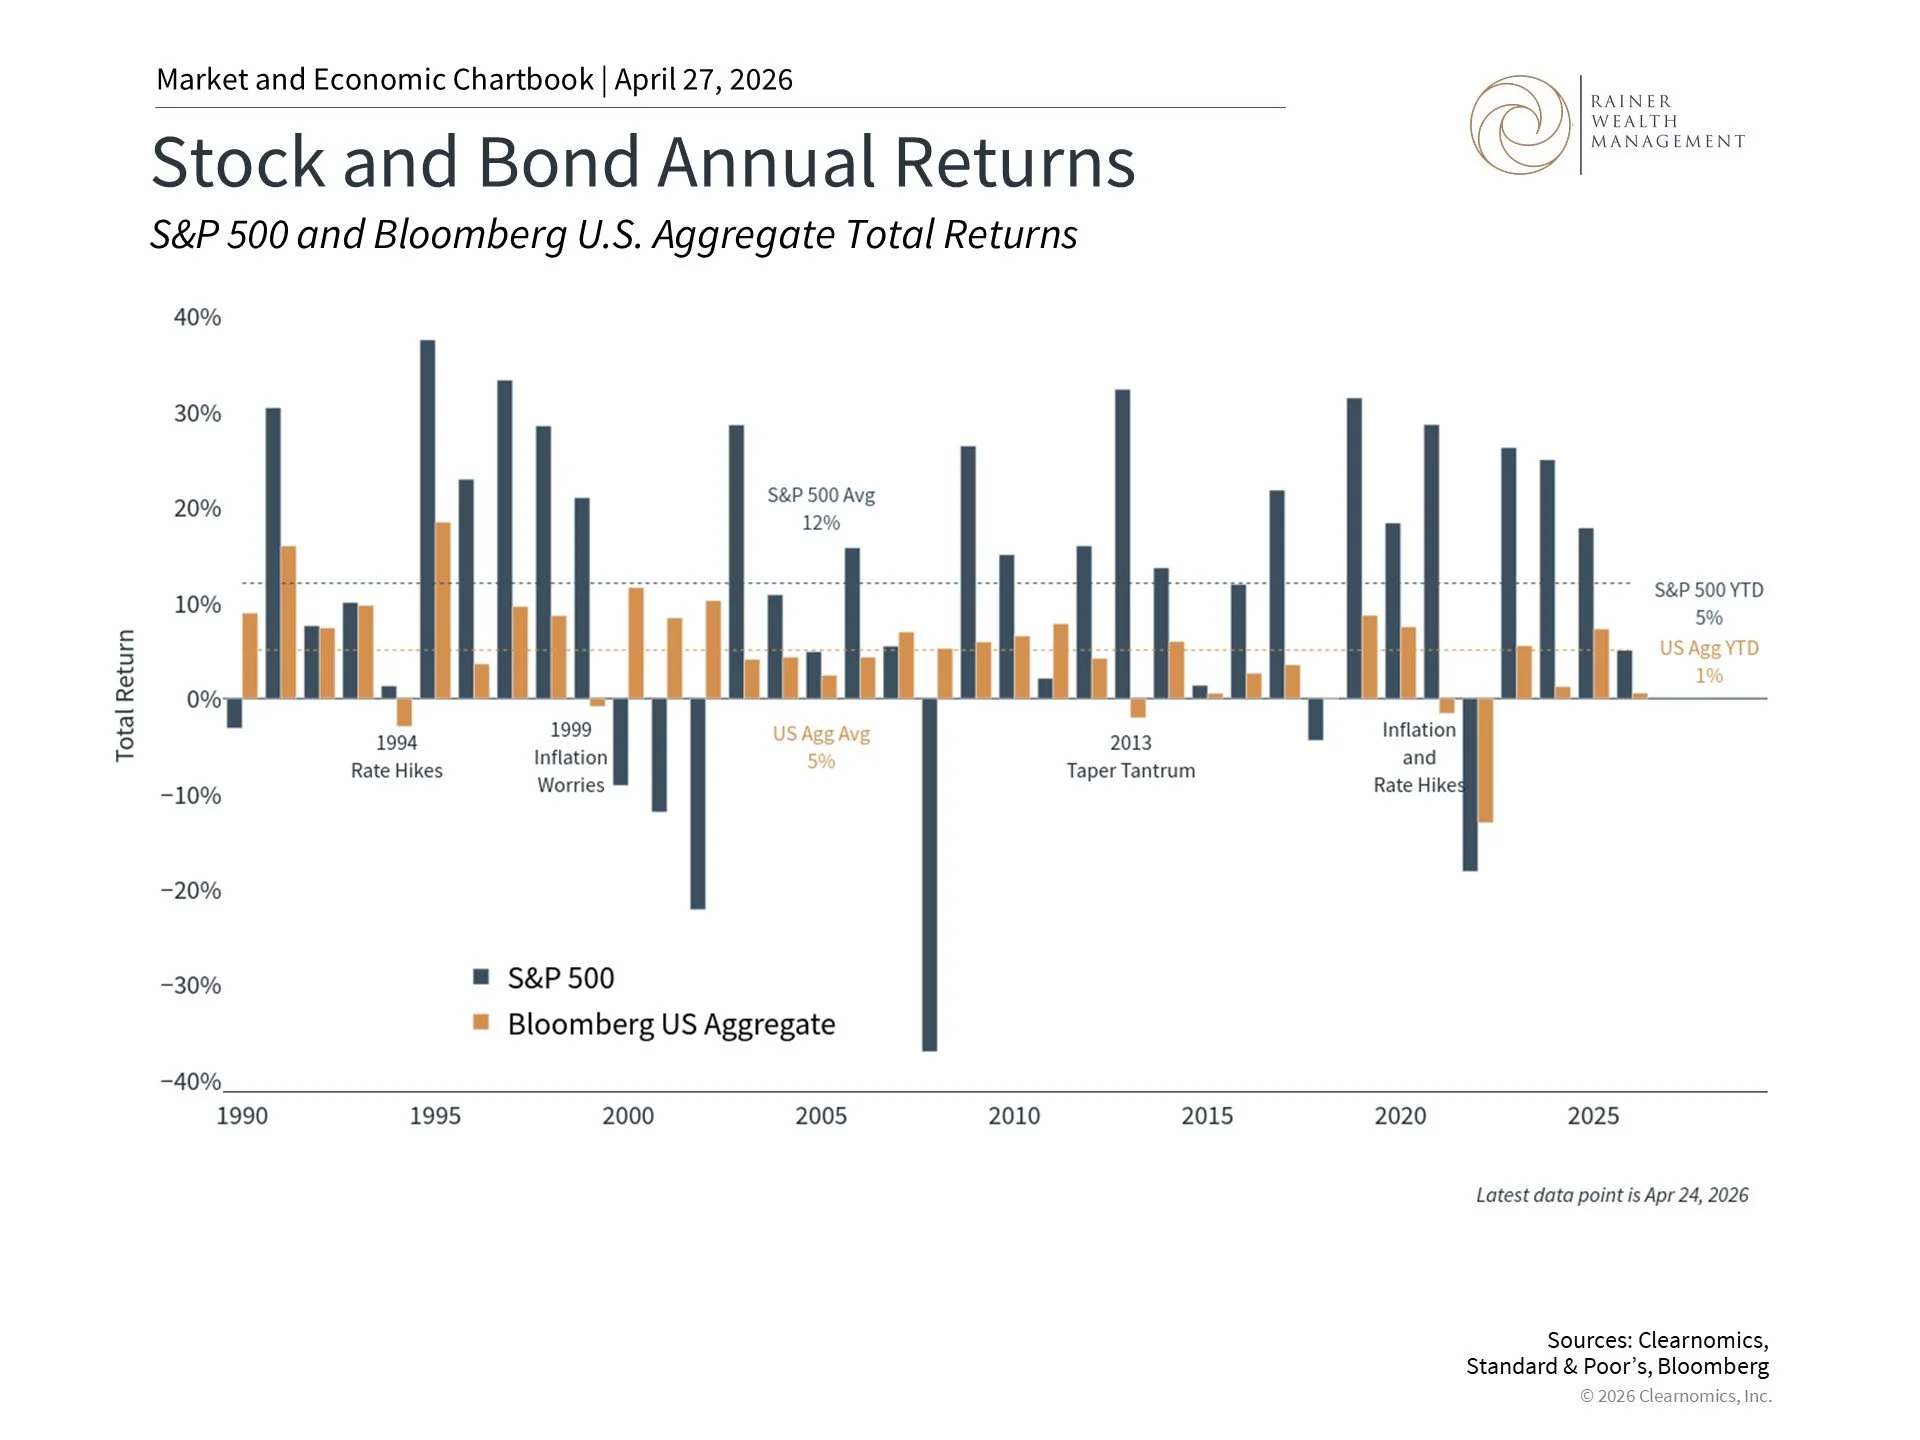
This chart shows annual returns for the S&P 500 and Bloomberg U.S. Aggregate total returns. The blue bars are S&P 500 returns while the gold are Bloomberg U.S. Aggregate returns. The blue and gold dotted lines denote their respective averages.
Every cycle naturally raises questions about whether traditional principles of portfolio management still apply. In 2022, when both stocks and bonds declined simultaneously due to rapidly rising inflation and interest rates, some investors wondered whether bonds still served a meaningful purpose in a diversified portfolio. This was true after the 2008 financial crisis as well, when bonds struggled due to historically low interest rates.
Over the past few years, bonds have not only recovered, but also provide meaningful income and portfolio balance. The Bloomberg U.S. Aggregate Bond Index has delivered positive returns in each of the past two years, helping to offset periods of equity volatility. International stocks and commodities have also contributed, providing additional diversification benefits.
This pattern is consistent with what history shows across cycles. Every period seems to raise the question of whether “this time is different” when it comes to the relationship between asset classes. In the 1970s, inflation challenged traditional portfolios. In the dot-com era, technology stocks became extremely popular, despite a lack of corporate profits, making other sectors appear boring. In 2022, rising rates created simultaneous pressure on both stocks and bonds. There are echoes of all of these challenges today.
Each time, focusing on the principles of diversification and long-term investing has proven to be the right approach. As uncertainty continues and new headlines cause markets to swing, it’s more important than ever to focus on the bigger picture.
The bottom line? More than three-and-a-half years into this bull market, the underlying principles of long-term investing remain as relevant as ever. Markets have consistently rewarded those who maintain balanced portfolios and stay focused on their long-term financial goals.
Footnotes
1. The number of pullbacks is based on S&P 500 index price returns since 1980.
2. The average size of corrections and recovery time are calculated from S&P 500 index total returns, since World War II.
For more information or to schedule a consultation, please give us a call at (925) 217-4280.
Trice C. Rainer, MBA, CFP®
Elizabeth Mintzer, CFP®
390 Diablo Road, Suite 202, Danville, CA 94526
Clearnomics Partnership Disclosure: We have partnered with Clearnomics to create and distribute economic and market commentary. Material presented in economic updates encompass contributions from both Rainer Wealth Management & Clearnomics.
Securities offered through Registered Representatives of Cambridge Investment Research, a broker/dealer, Member FINRA/SIPC. Advisory services through Cambridge Investment Research Advisors, Inc., a Registered Investment Adviser. Cambridge, Protected Investors of America and Rainer Wealth Management are not affiliated. Registered for Securities in CA, OH, TX, WA.