

Consumer Financial Health: Record Lows and Highs
Provided by Rainer Wealth Management
Consumer spending is the engine of the U.S. economy, accounting for roughly two-thirds of overall economic activity. In theory, when consumers feel financially secure and optimistic, they tend to spend more, driving corporate profits and economic growth. When they feel uncertain, they may tighten their belts. In reality, how consumers behave depends on many factors, especially because not all consumers are alike. For this reason, having a holistic understanding of the financial health of consumers is one of the most important ways for long-term investors to make sense of the current environment.
The picture today is positive but mixed. On one hand, household net worth is near record levels, the job market has improved, retail sales are strong, and gasoline prices are declining. On the other hand, consumer sentiment is near historic lows, savings rates have fallen sharply, debt levels remain elevated, and inflation continues to run above the Federal Reserve's target.
These conflicting signals reflect an economy that is performing well in general, but is also leaving some households feeling stretched. For long-term investors, understanding both sides of this picture is important for understanding economic trends as well as the importance of following a financial plan.
Consumers are feeling pessimistic despite healthy growth
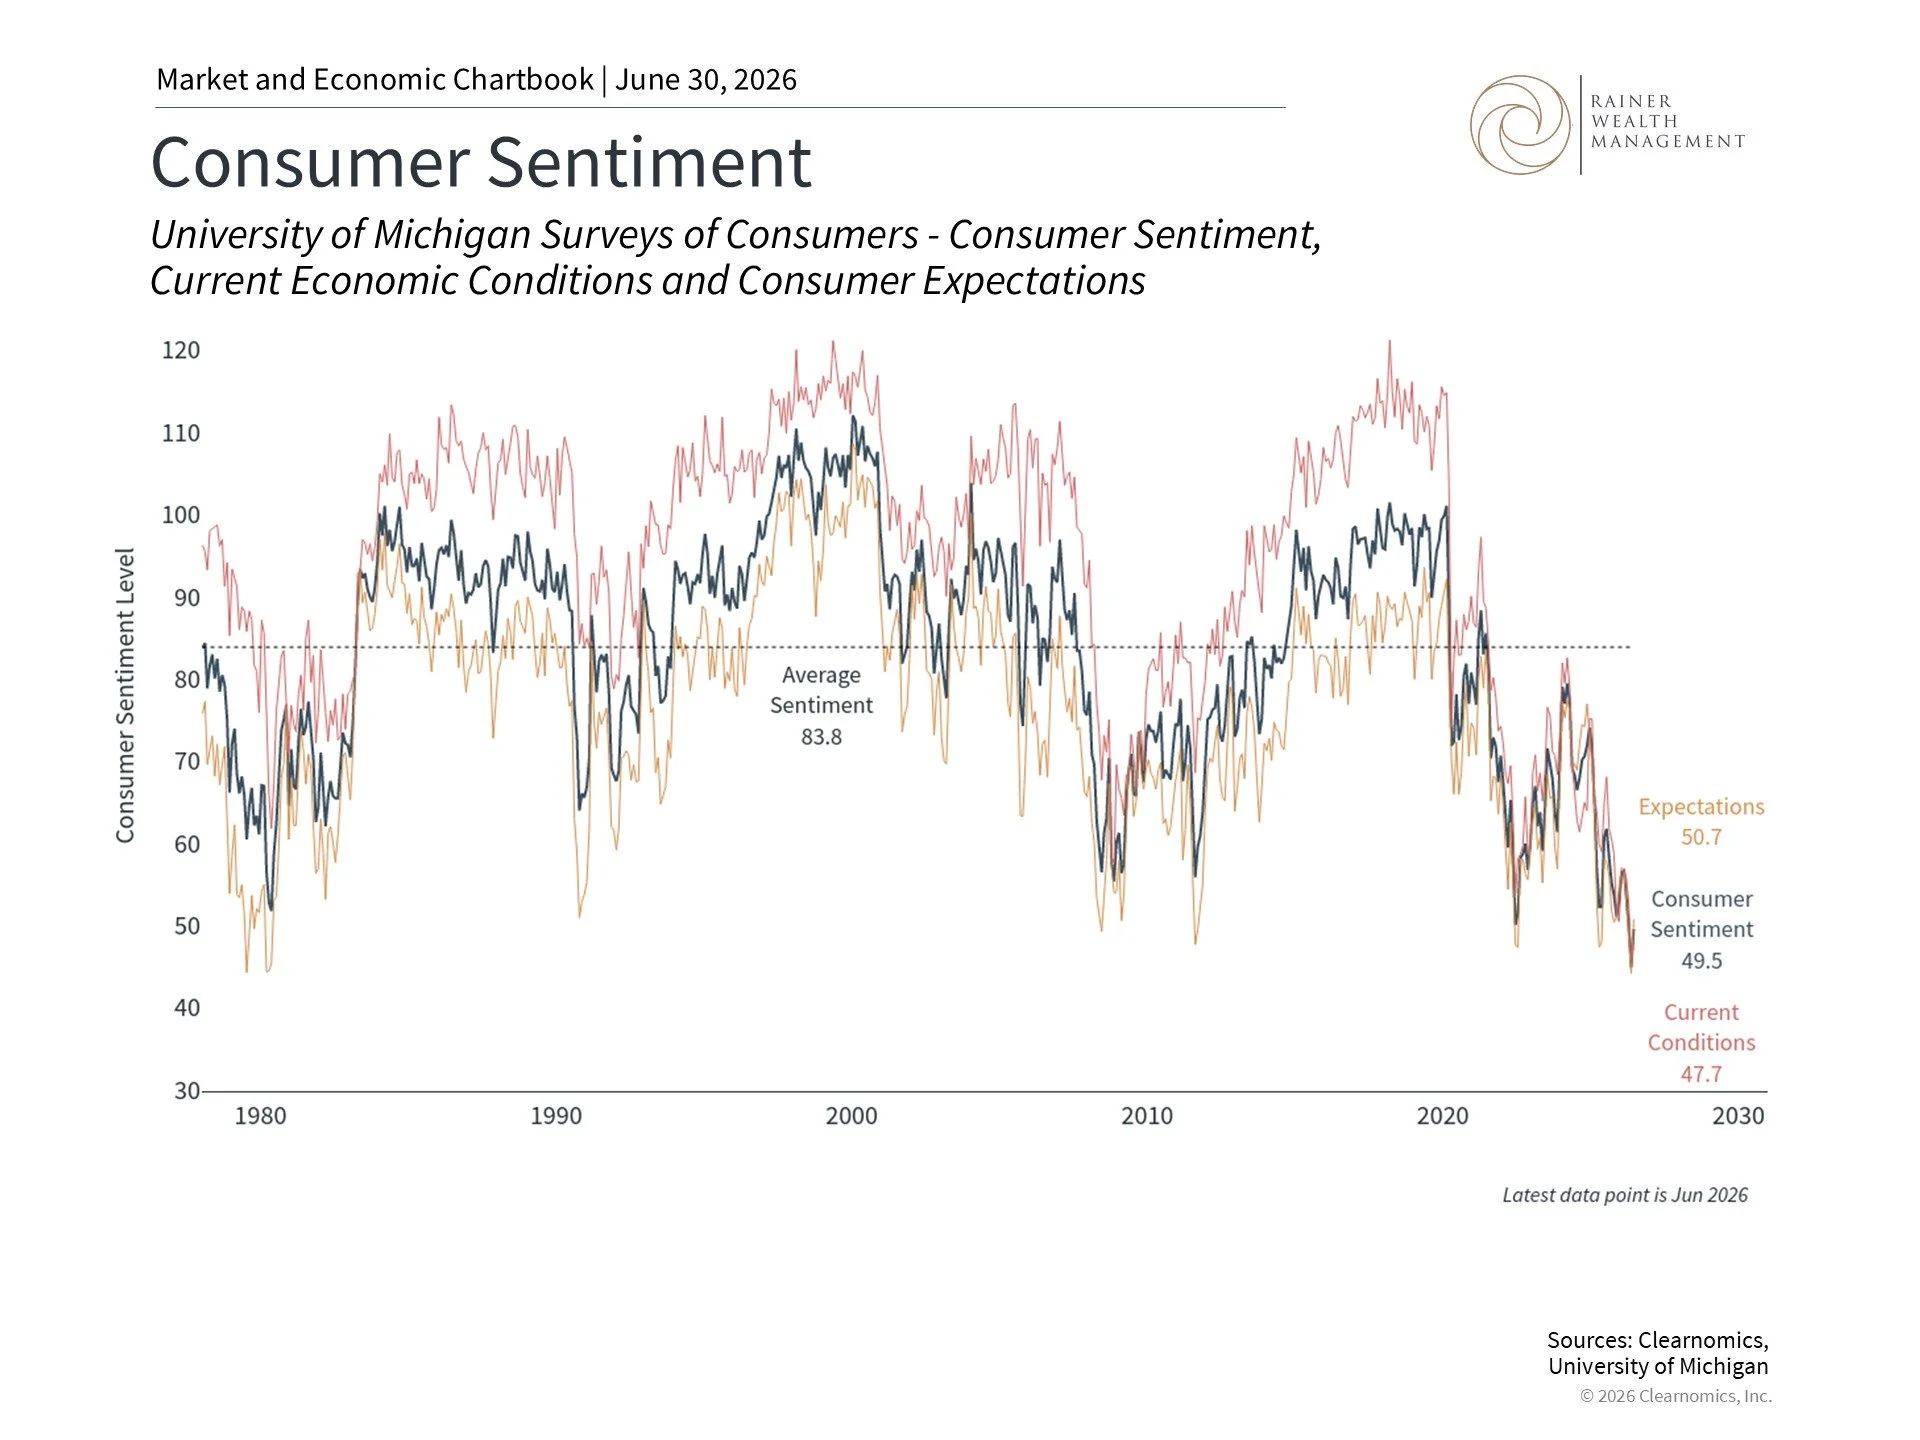
This chart reports three measures of consumer sentiment from the University of Michigan Surveys of Consumer Sentiment. The index of current economic conditions (ICC) is constructed from questions regarding individual's financial well being relative to a year ago and individuals perception timing of large purchases for their home such as an appliance. The index of current economic conditions (ICE) is derived from expectations for individual's financial situation in one year, expectations for the country as a whole in one year, and expectations for volatility in the next five years. The index of consumer sentiment is derived from all of the components of the ICC and the ICE.
According to the University of Michigan Surveys of Consumers, the consumer sentiment index was 49.5 in June 2026, well below the historical average of 83.8. This places sentiment near its historic low, comparable to levels seen during the worst of the 2008 financial crisis and the early pandemic period. One-year inflation expectations from the same survey have climbed to 4.6%, suggesting that concerns about rising prices remain a primary driver of pessimism.1
While it seems that there should be a direct connection between how consumers feel and whether they are willing to spend, this is not always the case. After all, consumer sentiment figures are based on representative surveys, so there can be data challenges, as well as a difference between how people say they feel and how they are behaving. For instance, retail sales have grown 6.9% year-over-year in the latest report, well above the long-term historical average of 4.7%.2
What explains this gap? An important part of the answer is the inflation that consumers have experienced over the past several years. Even though the rate of inflation has improved, the level of prices for everyday goods and services remains much higher than before the pandemic. Consumers who feel the ongoing weight of higher grocery, housing, and energy bills may feel pessimistic in surveys even as they continue spending for necessities and some discretionary items.
Additionally, the job market, while showing signs of improvement, also carries uncertainty related to the potential impact of artificial intelligence on employment. Wage growth has also slowed even though it remains at a historically strong annual rate of 3.6%. The challenge is that this is below the recent inflation readings driven by energy prices. These concerns spanning many different areas may shape how households think about the future, even if they continue to make purchases.
Household net worth reflects the strength of the economy and markets
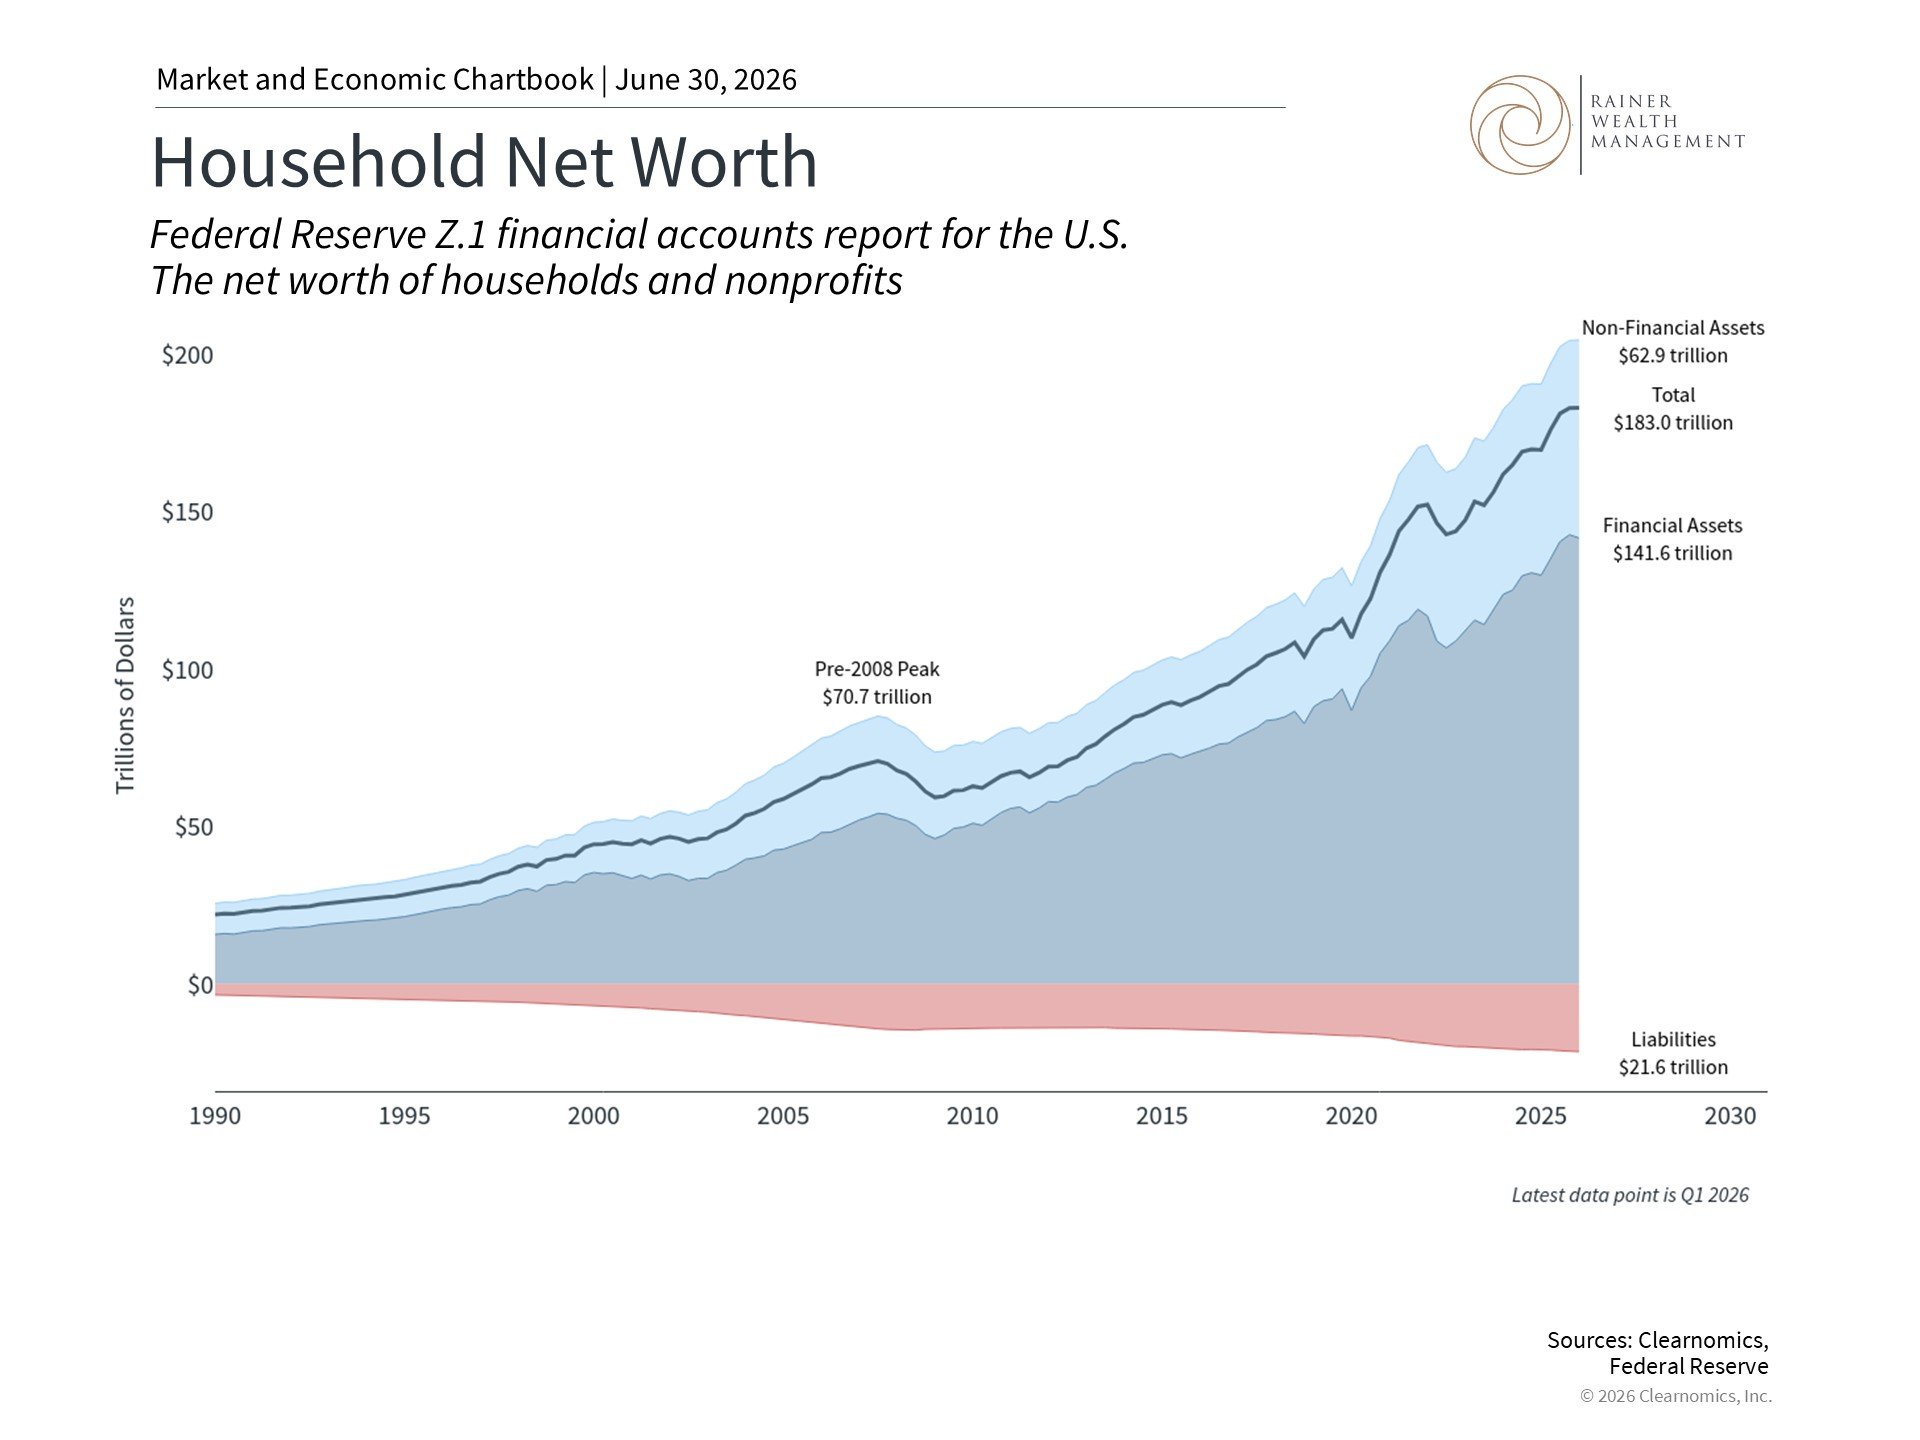
This chart shows the total net worth of households and nonprofits as reported by the Federal Reserve's Z1 report of U.S. financial accounts.
While sentiment is low, the overall balance sheet of American households has never been stronger. Total U.S. household net worth reached $183 trillion in the first quarter of 2026, a record high. Financial assets, including stocks and retirement accounts, have grown substantially over the current market cycle, driven by the stock market. Non-financial assets, such as homes, have also risen in value over the past several years.3
Of course, this masks the variation across income and wealth groups. A popular term right now, for instance, is that we have a “K-shaped" economy. Households with meaningful exposure to financial assets and real estate have seen their balance sheets strengthen considerably. For those without such assets, growth in wages has been strong, but they may also be experiencing higher debt levels which have been increasing steadily for the country as a whole. This includes credit card debt rising to $1.3 trillion, auto loans to $1.7 trillion, and student loan balances also climbing to $1.7 trillion.4
The wealth effect, or the tendency for consumers to spend more when they perceive themselves as wealthier, helps explain why aggregate spending has remained resilient even as sentiment has declined. This has different implications depending on the perspective we take. For the overall health of the economy, it’s preferable if many segments of the population are experiencing financial growth. When it comes to markets and portfolios, what primarily matters is the growth rate of earnings. So, while there may be challenges in some population segments, this does not necessarily mean it translates into a concern for investors.
Savings rates have declined
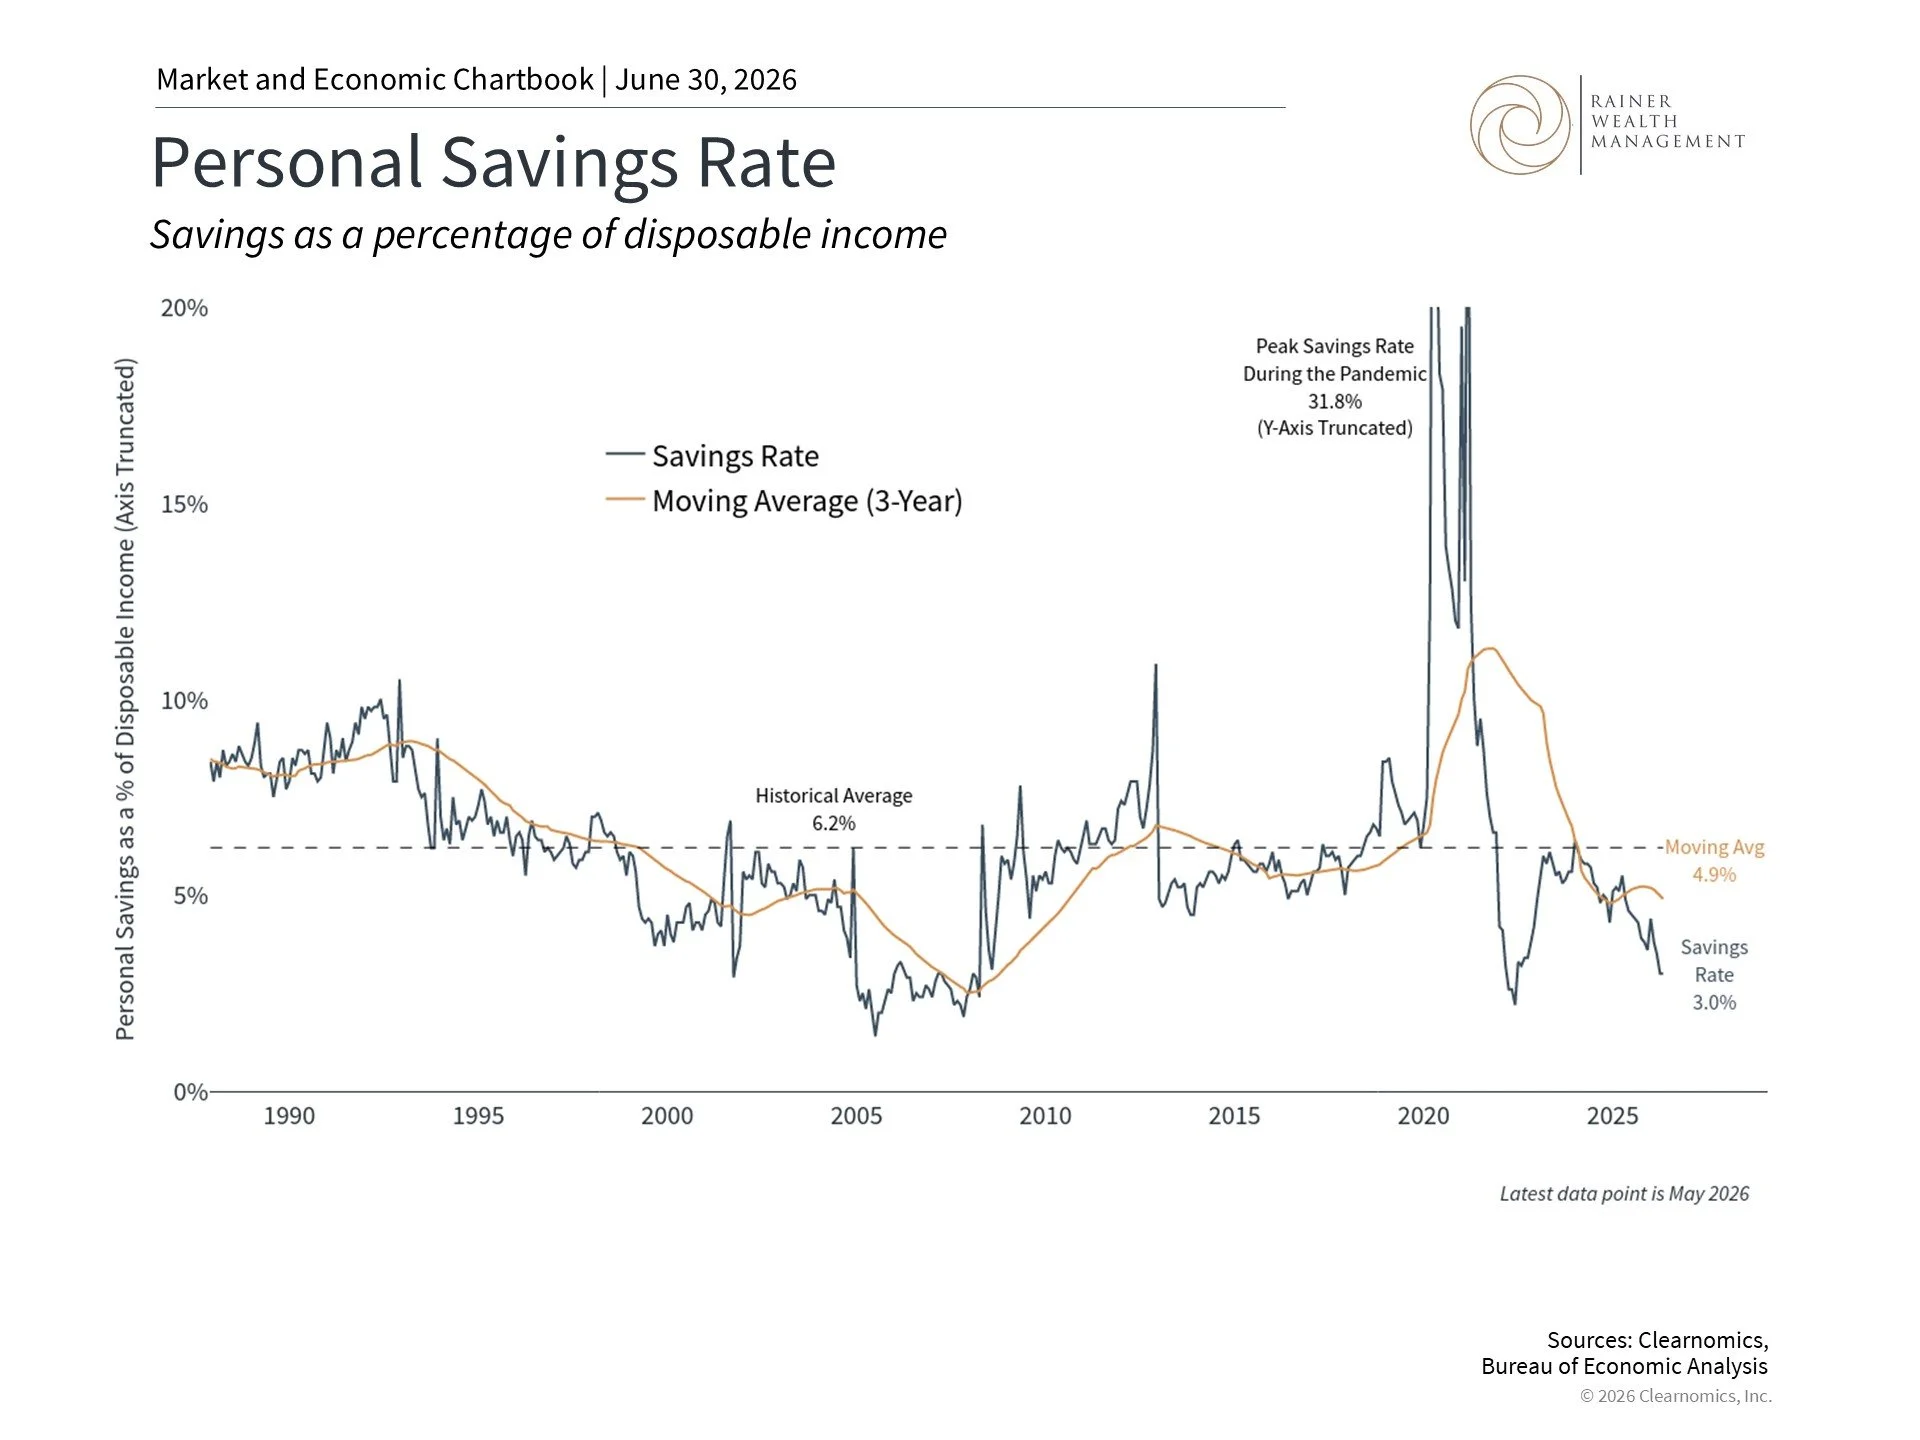
This chart tracks households savings rate as a percent of disposable income. The dotted line denotes the average savings rate.
The personal savings rate, which measures the amount of after-tax disposable income that individuals save, has declined to 3.0%, well below the historical average of 6.2%. For much of the 20th century, this rate was much higher, averaging 11.1% from 1960 to 1990. Today’s rates are also a reversal of the pandemic period when they briefly surged above 30% as households received government support and had limited opportunities to spend.5
The reasons for this are again related to inflation and energy prices. Consumer spending has remained strong, which means that the average household has spent rather than saved. Higher prices, including for necessities such as gasoline, also reduce the portion of each paycheck available to set aside. Additionally, demographic trends play a role. As the Baby Boomer generation moves further into retirement, savings rates will naturally decline as they draw down accumulated wealth. These shifts in the population mean that it’s not surprising that the rate has declined over the past several decades.
A low savings rate of 3.0% may leave some households with limited buffers against unexpected expenses or life events. From a financial planning perspective, this is an important area of focus. For long-term investors, the power of compounding means that dollars set aside early in a financial plan grow substantially over decades.
Finally, from a broad market perspective, there are many trends moving in the right direction. For example, oil prices have fallen from recent highs which could provide some inflation relief and help ease some of the pressure that has weighed on consumer sentiment. The job market has also shown improvement in hiring activity, and unemployment remains low. These are positive developments for households and for the outlook for consumer finances.
The bottom line? Consumer spending has been resilient overall, supporting the economy and markets despite mixed signals. For investors, this reinforces both the importance of building a financial plan and staying focused on longer-term trends.
References
1. https://www.sca.isr.umich.edu
2. https://www.census.gov/retail/sales.html
3. https://www.federalreserve.gov/releases/z1
4. https://www.federalreserve.gov/econres/scfindex.htm
5. https://www.bea.gov/data/income-saving/personal-saving-rate
For more information or to schedule a consultation, please give us a call at (925) 217-4280.
Trice C. Rainer, MBA, CFP®
Elizabeth Mintzer, CFP®
390 Diablo Road, Suite 202, Danville, CA 94526
Clearnomics Partnership Disclosure: We have partnered with Clearnomics to create and distribute economic and market commentary. Material presented in economic updates encompass contributions from both Rainer Wealth Management & Clearnomics.
Securities offered through Registered Representatives of Cambridge Investment Research, a broker/dealer, Member FINRA/SIPC. Advisory services through Cambridge Investment Research Advisors, Inc., a Registered Investment Adviser. Cambridge, Protected Investors of America and Rainer Wealth Management are not affiliated. Registered for Securities in CA, OH, TX, WA.